via UPFINA:
In the week of September 21st, the Redbook same store sales growth rate fell from 5.4% to 5.2%. That’s still very strong growth; the tariffs haven’t slowed spending. As the chart below shows, it will face very tough comparisons in December. Notably, it strayed far from retail sales growth in that month as December is when yearly retail sales growth bottomed.
Whenever we discuss Redbook sales growth it seems to become oddly controversial. Generally, the more up to the minute data is, the less reliable it is. The longer it takes for data to come out, including revisions, the more reliable it is. Since Redbook is giving us data from most of September and the August retail sales report only just came out, Redbook is quite early. This is just like how the regional Fed manufacturing reports tell us about the manufacturing sector before the ISM PMI and way before the industrial production report.
You probably shouldn’t change your macro thesis because of Redbook or regional Fed readings, but they can support a trend you’ve already noticed. For example, we’ve seen strong consumption growth despite the tariffs. Redbook sales growth gives us the first glimpse at data from after the latest round of tariffs went into effect. Bank of America’s proprietary credit spending data suggested August retail sales growth would be terrible, but it was off base. That’s the risk you take in trusting such early data.
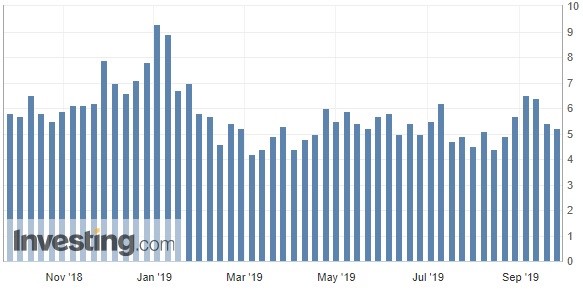
Conference Board Consumer Confidence Falls
In August, the University of Michigan consumer confidence index fell sharply from the prior month while the Conference Board index was very strong. The working thesis was that the University of Michigan report was impacted by financial markets, while the Conference Board index was impacted by the labor market. The University of Michigan index increased slightly in September and the Conference Board index plummeted the most this year as the chart below shows.
'U.S. consumer confidence posted the biggest drop since the start of the year as Americans’ expectations for the economy and the job market deteriorated, posing a risk to the household spending that is underpinning growth.' https://t.co/kwn0goCf2m pic.twitter.com/H48uDnmFkr
— Jesse Felder (@jessefelder) September 24, 2019
The reality is both reports were driven lower by the same thing, the trade war. Specifically, the overall index fell from 134.2 to 125.1 which missed even the low end of the estimate range which was 129.5.
The Present Situation index fell from 176 to 169 and the Expectations index fell from 106.4 to 95.8. That means the gap between the present situation and expectations indexes rose. So far, this gap hasn’t led to any trouble like historical charts imply it does. Its accuracy will depend on how badly the trade war impacts the economy since the trade war drove pessimism in both reports. The Conference Board report stated, “the escalation in trade and tariff tensions in late August appears to have rattled consumers.” We’d rather see the trade war rattling consumers than jobless claims spiking, although, this report did show weakness in labor market sentiment.
Weakness In Business Conditions & Labor Market
There was weakness across the board. It makes sense business conditions weren’t thought of highly since uncertainty hurts firms’ ability to make expansion plans. Consumers saying business conditions are “good” fell 3.6% to 37.3% and those saying conditions are “bad” rose 2.8% to 12.7%. That means the net percentage saying conditions are good fell 6.4%.
This net percentage fell in the expectations category as well as the chart below shows.
US. The key factor on confidence slump this morning was expectations of business conditions, which fell but remain in positive territory and far away from levels seen ahead of recession. pic.twitter.com/AQ9oL2Qtt1
— Daniel Lacalle (@dlacalle_IA) September 24, 2019
The percentage expecting business conditions to improve fell 2.6% to 19% and the percentage expecting conditions to get worse in the next 6 months rose 4.1% to 14.3%. This is pretty weak considering how great the overall confidence index is. The overall index went from amazing to great which is bad in rate of change terms.
The most important part of the report is sentiment on the labor market since that’s what consumers are the most knowledgeable about. The situation worsened considerably although it’s still positive. Those saying jobs are “plentiful” fell from 50.3% to 44.8%. Those saying jobs are “hard to get” fell 0.4% to 11.6%. As you can see from the chart below, the monthly decline in those saying jobs are plentiful was the largest since 2001.
US jobs are still plentiful but the degree of plenty reduced markedly in September. pic.twitter.com/VvS9IDLPSN
— econhedge (@econhedge) September 24, 2019
It had a lot of room to fall and it did just that. Expectations for the labor market also got worse as those expecting more jobs fell from 19.9% to 17.5% and those expecting fewer jobs rose from 13.7% to 15.7%. This is in tune with the decline in payroll growth, but not in line with the very low jobless claims. Finally, short term income prospects got worse as the percentage expecting improvement fell from 24.7% to 19%.
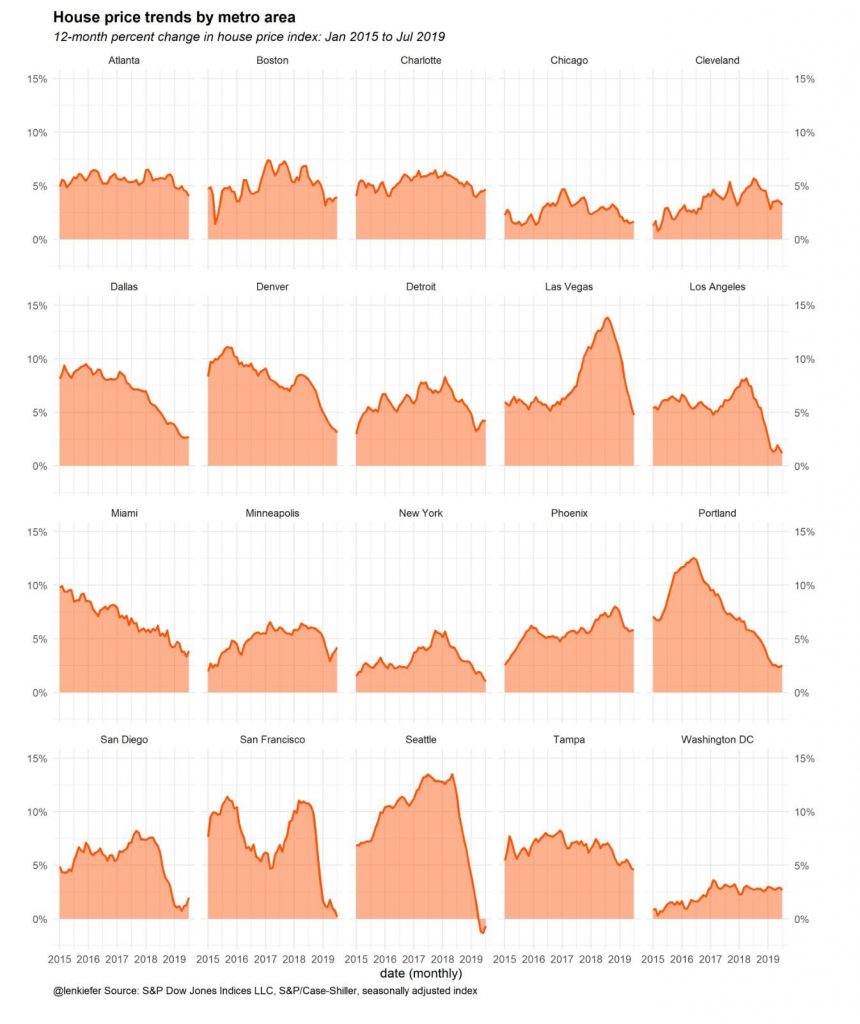
Home Price Growth
The FHFA home price index and the Case Shiller price index’s growth rates went in opposite directions as FHFA yearly growth in July rose from 4.8% to 5% and Case Shiller price growth fell 7 basis points to 3.2% which was once again the weakest growth since September 2012. Even with that decline, it’s still quicker than weekly wage growth which was 2.6% in July and 2.9% in August. On the one hand, the Case Shiller growth rate faced easier comparisons in July. On the other hand, comps are about to get much easier. There might even be a bottom in price growth soon as mortgage rates are near their record low.
Just like in June, the 20 city Case Shiller growth rate was significantly below the national rate as it fell from 2.2% to 2%. The charts below break down the yearly growth in each city. Seattle actually had a growth improvement as it went from -1.3% to -0.6%. The comps are about to get much easier which could allow for positive growth. Las Vegas is behind Seattle in that its yearly growth rate decline is still going strong as growth fell from 5.5% to 4.7%. Its growth rate peaked later than Seattle’s did. With the big decline in Las Vegas price growth, Phoenix price growth was the highest by default as it stayed at 5.8%.
Conclusion
Redbook same store sales growth shows consumers aren’t being impacted by the latest tariffs. On the other hand, the Conference Board index plummeted the most in a year as suddenly confidence in the labor market has waned significantly. Home price growth might be in the process of bottoming as comps get easier and the effect of very low mortgage rates is included in the data. Remember, these home price growth reports are still just releasing data from July.