Wolf Richter wolfstreet.com, http://www.amazon.com/author/wolfrichter
Now even the surface of the market has softened, not just the underlying dynamics.
Back in August 2018, I stuck my neck out and said that the housing market in Sonoma County in the San Francisco Bay Area had experienced a turning point in July, based on data and boots-on-the-ground observations by Thomas Stone, a broker in Sonoma County, which showed how the housing market was deteriorating beneath the surface while prices had just hit a record.
So here is an update on my neck sticking out this far, based on data through April 2019. The red in the charts below indicates data since July 2018.
Spoiler alert: median prices have now reacted.
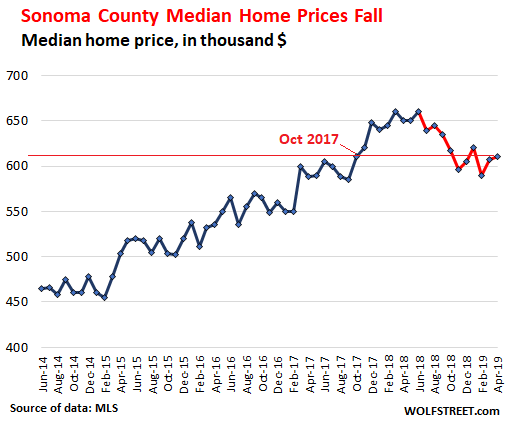
Back in June, 2018, the median price of all homes sold in the county hit $660,000, same as in March 2018, a record. In July 2018, the median price dropped from the high, but given the volatility of median prices, the drop might just have been noise, rather than a reaction to the deteriorating dynamics of the market.
“The median price is the last metric to move, and it has met its inflection point in July,” I said at the time, sticking my neck out as far as possible.
It didn’t take long for the median price to zigzag lower. In April, at $610,000, it was down 6.2% from April last year. This is the spring selling season, off the lows in the winter, and seasonally, prices nearly always rise from those lows, and they did so this April but not enough. The median price in April was where it had first been in October 2017:
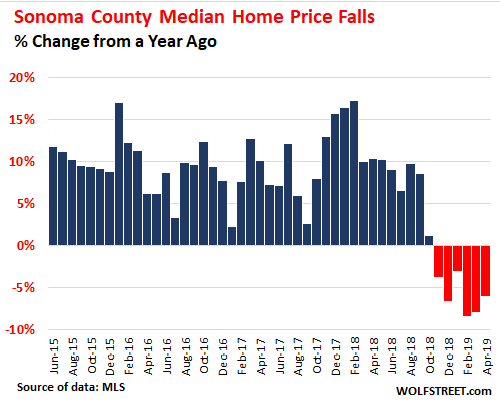
On a year-over-year basis, the median price movements turned negative in November. April (-6.2% year-over-year) was the sixth month in a row of year-over-year price declines:
So here are the underlying dynamics.
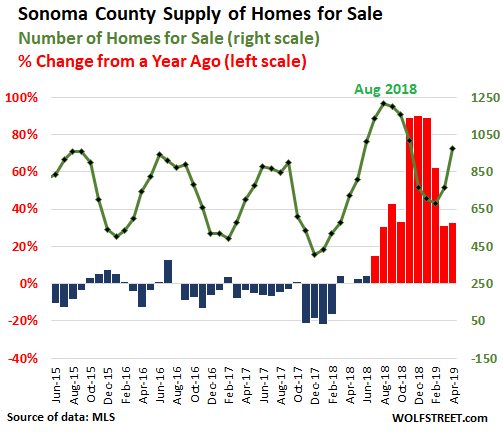
Supply of homes listed for sale started soaring last July after years of an often proclaimed “inventory shortage.” By August, supply reached 1,216 homes, a number not seen in years. In November, December, and January, supply was up 90% year-over-year. In April, supply rose 33% from April last year to 974, the highest supply for April since the end of Housing Bust 1.
This chart shows the number of homes for sale in the county (green line, right scale), and the percentage change from the same month a year earlier:
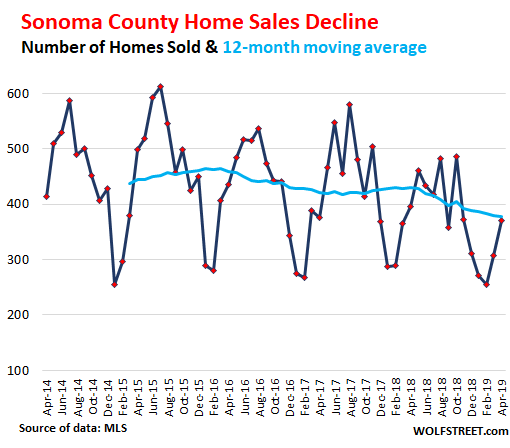
Home sales in April fell 6.3% from April a year ago to 370 homes. Lower prices stimulate some sales: In the five months through December last year, sales had dropped between 16% and 26% year-over-year.
To average out the seasonality and clarify the longer trend, the chart below shows not only home sales on a month basis but also the 12-month moving average (teal line): In April, the 12-month moving average at 377 was down 14% from the 12-month average in April 2018, and down 12% from the average in April 2017:
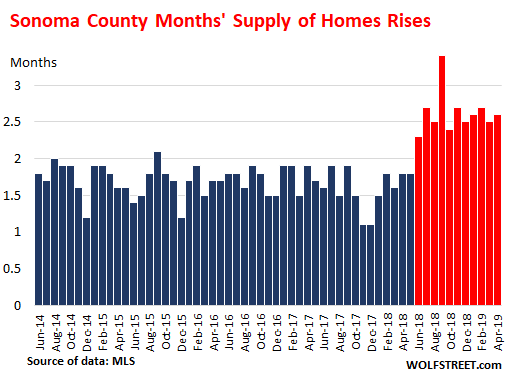
Forget the six-month-supply rule.
Many years ago, six months supply was considered a balanced market. This was when it took months from listing a house to closing the sale. Now, housing market participants rely on technologies that speed up the process: Online listings that are instantly viewable by everyone (rather than printed listings that took a long time to get to the potential buyer), online research tools, drone videos of the home, automated income verification and credit approvals for lenders, etc.
These technologies impact every part of the market. Homes can enter escrow within 24 hours of being listed online. In the prior era, it took at least 30 days to have the first open house. The time of the entire process, from listing to closing the transaction, has been shortened from months to just days or a couple of weeks. And these homes disappear from the market much faster – which lowers the months’ supply number.
So the old rule that six months of supply signifies a balanced market went out the window over a decade ago. Then the rule was that four months’ supply signifies a balanced market. But that rule may already have gone out the window too because in many markets where prices have been edging lower on a year-over-year basis, supply is still below four months, and what should be a seller’s market, has already turned into a buyer’s market, including in Sonoma County.
In Sonoma County, months’ supply of homes for sale – the number of homes for sale divided by the number of homes sold – jumped from 1.8 months in April 2018 to 2.6 months in April 2019. By the classic calculations, this is still a market with a supply shortage; but with today’s technologies, 2.6 months means reasonable supply (prices have started to edge down) though it may still be the wrong supply, with homes being priced too high:
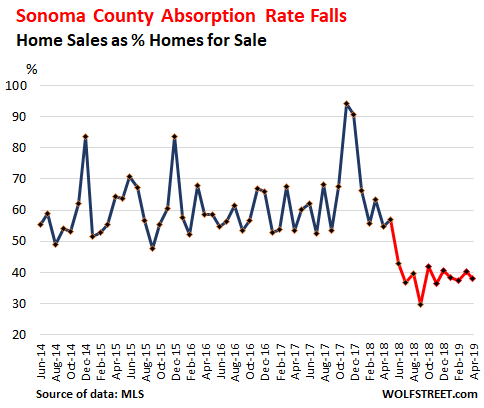
The “Absorption Rate” (the number of closed sales divided by the number of homes for sale) in the chart below shows the percentage of the supply that has been “absorbed” by the market. The spike late 2017 to 94% was in part due to the wildfires in the county. By September 2018, the absorption rate plunged to 30%. In April this year, it was 38%:
This isn’t a collapse of a market, but just some of the hot air easing out of it. All this data is for the county overall. There are big differences by submarkets and price points.
In Santa Rosa, the county seat, “open houses for homes priced below $800,000 are seeing 40 to 50 groups come through in three hours, which is a lot,” said Thomas Stone, the broker. “And I’m seeing a lot of multiple offers for homes that are well priced, more than last year.”
And that’s the key: If a desirable home is priced where the market is, it will sell. If sellers try to obtain aspirational prices, the home will sit.
And one more thing: “Places that are suitable for vacation rentals bring large premiums — too large, in my opinion,” Stone said. Yeah, the new thing; everyone is going to make a killing with vacation rentals.