Rents in San Francisco are still crazy-overpriced.
By Wolf Richter for WOLF STREET.
There are now at least three factors that have plowed into the US housing market – and the rental market is reacting in near-real time to them: The unicorn-startup bust that began last year and built up into a crescendo this year; the Pandemic-inspired move to work-from-home; and the oil-and-gas bust that took on special vigor this spring when crude oil prices totally collapsed.
People are bailing out of some places and moving elsewhere. In the most expensive cities, rents are dropping, but in other cities – a lot of them – rents are skyrocketing by the double-digits.
Crazy-overpriced San Francisco rents.
Rents in San Francisco plunged more than in any other major market in June. This is still the most expensive city to rent in, though there are a few zip codes in Manhattan and in Los Angeles where rents are more expensive than in the most expensive zip code in San Francisco. But it got less expensive in June.
In June, the median asking rent for a one-bedroom apartment dropped 2.4% from May, to $3,280, down 11.8% from June last year, which made the city the fastest-dropping rental market in the US.
The median asking rent for two-bedroom apartments in June fell 1.8% from May to $4,340 and was down 9.6% year-over-year.
The still crazy-overpriced San Francisco market – it’s called the “Housing Crisis” locally – had hit a ceiling in October 2015, with the median asking rent for a 1-BR apartment at $3,670 and for a 2-BR at $5,000. Then rents declined by close to 10% into 2017 before picking up again. While 1-BR rents eked out a new record in June last year (by $50), 2-BR rents never got close to their October 2015 record and are now 13.2% below it.
These are median asking rents. “Median” means half the asking rents are higher, and half are lower. “Asking rent” is the advertised rent. This is a measure of the current market in near-real time, like the price tag in a store that can be changed from day to day to attract shoppers, depending on market conditions. Asking rent is not a measure of what tenants are currently paying on their existing leases or under rent-control programs.
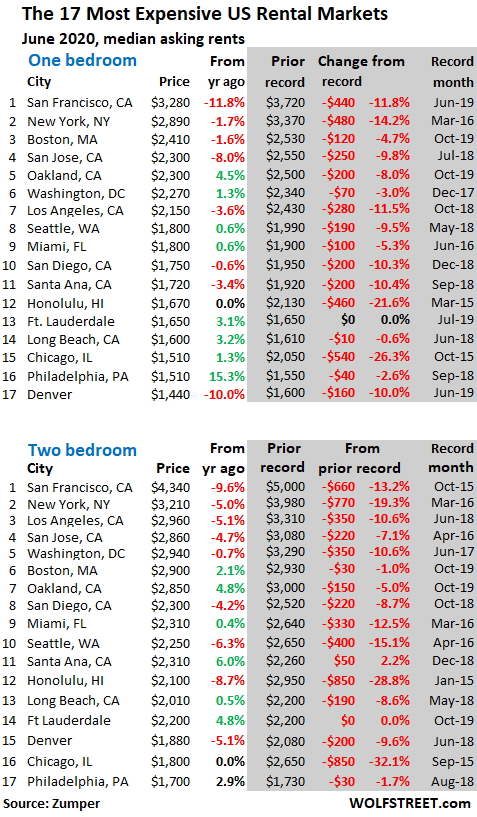
A sea of red in the 17 most expensive rental markets.
The table below shows the 17 most expensive major rental markets by median asking rents. The shaded area shows their respective peaks and changes from those peaks. Almost all of them have declined from their peaks – with eight of them by the double digits, led by Chicago and Honolulu, where rents have gotten crushed since their respective peaks in 2015.
Seattle is now solidly on the list of double-digit decliners, booking the third largest decline-from-peak in 2-BR rents (-15.1%), behind Chicago and Honolulu, and the ninth largest in 1-BR rents (-9.5%).
Denver, not long ago one of the hottest rental markets in the US, has frozen over, with declines-from-peak in the -10% range.
The rents we’re discussing here are for apartments in apartment buildings, including new construction. Not included are rents for single-family houses, condos for rent, rooms, efficiency apartments, and apartments with three or more bedrooms. The data is collected by Zumper from over 1 million active listings, including Multiple Listings Service (MLS) in the 100 largest markets.
The Cities with the biggest %-declines in 1-BR rents.
The table below shows the 31 cities with the largest year-over-year rent declines in June for 1-BR apartments, with San Francisco at the top, followed by Syracuse, NY, a college town now under siege from the Pandemic. Denver, with a 10% year-over-year decline, rounds out the double-digit decliners.
Then there are a bunch of cities in the Texas-Oklahoma-Louisiana oil-patch on this list, including Tulsa and Houston in 5th and 6th place. There are eight cities in Texas on this list. Louisiana is represented by New Orleans (#18) and Baton Rouge (#31).
The oil patch is in serious trouble. The oil bust started in mid-2014, when the price of crude oil grade WTI began its long decline from $100-plus per barrel to a low of $26 a barrel in early 2016. Then the price began to recover but never made it back to levels where the shale oil industry can survive long-term.
In January this year, WTI started heading lower again, and this April hit a new low, when in some places the price at the wellhead dropped to zero and when WTI futures briefly collapsed below zero for the first time ever.
Hundreds of oil-and-gas drillers have filed for bankruptcy over the past three years, and the speed and magnitude of those bankruptcy filings is picking up, with one of the biggies, Chesapeake, which is based in Oklahoma City, filing for bankruptcy on Sunday.
Houston is the center of the US oil patch, and despite its vast and diversified economy, the city has gotten slammed by the oil-and-gas bust in various ways, including by the highest office vacancy rates in the US, now at a catastrophic 24.5%.
Also on this list are Silicon Valley (San Jose), Southern California (Los Angeles, Anaheim, Santa Ana), and three markets in Florida, among others.
| Biggest Declines, in % |
1 BR Rent | Y/Y % | |
| 1 | San Francisco, CA | $3,280 | -11.8% |
| 2 | Syracuse, NY | $860 | -11.3% |
| 3 | Denver, CO | $1,440 | -10.0% |
| 4 | Irving, TX | $1,080 | -9.2% |
| 5 | Tulsa, OK | $590 | -9.2% |
| 6 | Houston, TX | $1,100 | -9.1% |
| 7 | Madison, WI | $1,080 | -8.5% |
| 8 | Aurora, CO | $1,090 | -8.4% |
| 9 | San Jose, CA | $2,300 | -8.0% |
| 10 | Orlando, FL | $1,220 | -6.9% |
| 11 | Durham, NC | $1,040 | -6.3% |
| 12 | Laredo, TX | $780 | -6.0% |
| 13 | Anaheim, CA | $1,600 | -5.9% |
| 14 | Jacksonville, FL | $900 | -5.3% |
| 15 | Charlotte, NC | $1,200 | -4.8% |
| 16 | Fort Worth, TX | $1,100 | -4.3% |
| 17 | Los Angeles, CA | $2,150 | -3.6% |
| 18 | New Orleans, LA | $1,380 | -3.5% |
| 19 | Santa Ana, CA | $1,720 | -3.4% |
| 20 | Seattle, WA | $1,800 | -2.7% |
| 21 | Plano, TX | $1,130 | -2.6% |
| 22 | Tampa, FL | $1,150 | -2.5% |
| 23 | Corpus Christi, TX | $830 | -2.4% |
| 24 | Louisville, KY | $860 | -2.3% |
| 25 | San Antonio, TX | $880 | -2.2% |
| 26 | Salt Lake City, UT | $1,050 | -1.9% |
| 27 | Raleigh, NC | $1,020 | -1.9% |
| 28 | New York, NY | $2,890 | -1.7% |
| 29 | Boston, MA | $2,410 | -1.6% |
| 30 | Dallas, TX | $1,230 | -1.6% |
| 31 | Baton Rouge, LA | $820 | -1.2% |
The Cities with biggest %-increases in 1-BR rents.
OK, get ready. Among the 100 largest rental markets are 9 cities where rents skyrocketed by over 15% year-over-year in June. And except for Philadelphia, all of them sport median asking rents for 1-BR apartments that are well below the national median ($1,229 according to Zumper). Meaning these cities with these huge rent increases are still deep in the lower half of the rental spectrum. In total, there are 20 cities with double-digit rent increases:
| Biggest Increases, in % | 1 BR Rent | Y/Y % | |
| 1 | Cleveland, OH | $940 | 16.0% |
| 2 | Indianapolis, IN | $870 | 16.0% |
| 3 | Columbus, OH | $810 | 15.7% |
| 4 | Rochester, NY | $970 | 15.5% |
| 5 | Chattanooga, TN | $900 | 15.4% |
| 6 | Cincinnati, OH | $900 | 15.4% |
| 7 | Philadelphia, PA | $1,510 | 15.3% |
| 8 | St Louis, MO | $910 | 15.2% |
| 9 | Norfolk, VA | $920 | 15.0% |
| 10 | Lincoln, NE | $770 | 14.9% |
| 11 | Newark, NJ | $1,320 | 14.8% |
| 12 | Des Moines, IA | $930 | 14.8% |
| 13 | Detroit, MI | $700 | 14.8% |
| 14 | Wichita, KS | $700 | 14.8% |
| 15 | Bakersfield, CA | $840 | 13.5% |
| 16 | Reno, NV | $1,030 | 13.2% |
| 17 | Baltimore, MD | $1,320 | 11.9% |
| 18 | St Petersburg, FL | $1,230 | 11.8% |
| 19 | Akron, OH | $610 | 10.9% |
| 20 | Boise, ID | $1,060 | 10.4% |
| 21 | Tucson, AZ | $700 | 9.4% |
| 22 | Buffalo, NY | $1,080 | 9.1% |
| 23 | Chesapeake, VA | $1,080 | 9.1% |
| 24 | Fresno, CA | $1,090 | 9.0% |
| 25 | Nashville, TN | $1,340 | 8.9% |
| 26 | Memphis, TN | $790 | 8.2% |
| 27 | Sacramento, CA | $1,360 | 7.9% |
| 28 | Colorado Springs, CO | $990 | 7.6% |
| 29 | Arlington, TX | $880 | 7.3% |
| 30 | Albuquerque, NM | $750 | 7.1% |
| 31 | Gilbert, AZ | $1,280 | 6.7% |
Among the top 100 cities, 59 cities experienced year-over-year increases in the median asking rent in June. In eight cities, there was no change in rents. And in 33 cities, asking rents declined, including in many of the largest cities in the US.
The top 100 rental markets, from most expensive to least expensive.
The list goes from San Francisco to Tulsa, with asking rents for 1-BR and 2-BR apartments, in order of 1-BR rents, from $3,280 in San Francisco (-11.8%) to $590 in Tulsa (-9.2%).
These rents that are dropping in some markets and surging in others show two things:
- Rental markets are local, and the median national rent is irrelevant at the local level.
- Big shifts are underway in housing, and the rental market is pointing out the weaknesses in demand where it exists in near-real time.
Markets where rents are increasing 10% or 15% a year are asking for trouble unless they have a booming job market with surging wages – this was the case in San Francisco, Seattle, and other hot markets. But if they don’t have surging wages, many renters, who are already tapped out, will run out of money. And it’s renters that keep the show going.
You can search the list list via the search box in your browser. If your smartphone clips this 6-column table on the right, hold your device in landscape position:
| 1-BR rent | Y/Y % | 2-BR rent | Y/Y % | ||
| 1 | San Francisco, CA | $3,280 | -11.8% | $4,340 | -9.6% |
| 2 | New York, NY | $2,890 | -1.7% | $3,210 | -5.0% |
| 3 | Boston, MA | $2,410 | -1.6% | $2,900 | 2.1% |
| 4 | Oakland, CA | $2,300 | 4.5% | $2,850 | 4.8% |
| 4 | San Jose, CA | $2,300 | -8.0% | $2,860 | -4.7% |
| 6 | Washington, DC | $2,270 | 1.3% | $2,920 | 2.5% |
| 7 | Los Angeles, CA | $2,150 | -3.6% | $2,960 | -5.1% |
| 8 | Miami, FL | $1,800 | 0.6% | $2,310 | 0.4% |
| 8 | Seattle, WA | $1,800 | -2.7% | $2,250 | -6.3% |
| 10 | San Diego, CA | $1,750 | -0.6% | $2,300 | -4.2% |
| 11 | Santa Ana, CA | $1,720 | -3.4% | $2,310 | 6.0% |
| 12 | Honolulu, HI | $1,670 | 0.0% | $2,100 | -8.7% |
| 13 | Fort Lauderdale, FL | $1,650 | 3.1% | $2,200 | 4.8% |
| 14 | Anaheim, CA | $1,600 | -5.9% | $1,960 | -7.5% |
| 14 | Long Beach, CA | $1,600 | 3.2% | $2,010 | 0.5% |
| 16 | Chicago, IL | $1,510 | 1.3% | $1,800 | 0.0% |
| 16 | Philadelphia, PA | $1,510 | 15.3% | $1,750 | 2.9% |
| 18 | Providence, RI | $1,470 | 2.8% | $1,650 | 4.4% |
| 19 | Atlanta, GA | $1,440 | 5.1% | $1,840 | 5.7% |
| 19 | Denver, CO | $1,440 | -10.0% | $1,880 | -5.1% |
| 21 | Portland, OR | $1,420 | 4.4% | $1,750 | 1.2% |
| 22 | Minneapolis, MN | $1,400 | 0.0% | $1,900 | 3.8% |
| 22 | Scottsdale, AZ | $1,400 | 1.4% | $1,870 | -2.1% |
| 24 | New Orleans, LA | $1,380 | -3.5% | $1,610 | 5.2% |
| 25 | Sacramento, CA | $1,360 | 7.9% | $1,600 | 8.8% |
| 26 | Nashville, TN | $1,340 | 8.9% | $1,450 | 7.4% |
| 27 | Baltimore, MD | $1,320 | 11.9% | $1,540 | 10.8% |
| 27 | Newark, NJ | $1,320 | 14.8% | $1,680 | 14.3% |
| 29 | Gilbert, AZ | $1,280 | 6.7% | $1,490 | 4.2% |
| 30 | Austin, TX | $1,250 | 5.0% | $1,520 | 0.7% |
| 30 | Chandler, AZ | $1,250 | 3.3% | $1,440 | -0.7% |
| 32 | Dallas, TX | $1,230 | -1.6% | $1,680 | -1.8% |
| 32 | St Petersburg, FL | $1,230 | 11.8% | $1,600 | 3.9% |
| 34 | Orlando, FL | $1,220 | -6.9% | $1,400 | -6.7% |
| 35 | Charlotte, NC | $1,200 | -4.8% | $1,370 | 0.0% |
| 36 | Tampa, FL | $1,150 | -2.5% | $1,390 | 4.5% |
| 37 | Plano, TX | $1,130 | -2.6% | $1,540 | -0.6% |
| 38 | Henderson, NV | $1,120 | -0.9% | $1,350 | 0.0% |
| 39 | Richmond, VA | $1,110 | 2.8% | $1,370 | 11.4% |
| 40 | Fort Worth, TX | $1,100 | -4.3% | $1,360 | 1.5% |
| 40 | Houston, TX | $1,100 | -9.1% | $1,310 | -6.4% |
| 42 | Aurora, CO | $1,090 | -8.4% | $1,350 | -9.4% |
| 42 | Fresno, CA | $1,090 | 9.0% | $1,240 | 8.8% |
| 44 | Buffalo, NY | $1,080 | 9.1% | $1,350 | 14.4% |
| 44 | Chesapeake, VA | $1,080 | 9.1% | $1,250 | 4.2% |
| 44 | Irving, TX | $1,080 | -9.2% | $1,390 | -10.3% |
| 44 | Madison, WI | $1,080 | -8.5% | $1,310 | -5.1% |
| 44 | Pittsburgh, PA | $1,080 | 1.9% | $1,350 | 3.8% |
| 49 | Boise, ID | $1,060 | 10.4% | $1,120 | 1.8% |
| 50 | Salt Lake City, UT | $1,050 | -1.9% | $1,300 | -5.1% |
| 50 | Virginia Beach, VA | $1,050 | 0.0% | $1,250 | 1.6% |
| 52 | Durham, NC | $1,040 | -6.3% | $1,230 | -3.1% |
| 53 | Reno, NV | $1,030 | 13.2% | $1,350 | 3.1% |
| 54 | Raleigh, NC | $1,020 | -1.9% | $1,200 | 0.0% |
| 55 | Phoenix, AZ | $1,010 | 1.0% | $1,280 | 2.4% |
| 56 | Las Vegas, NV | $1,000 | 1.0% | $1,200 | 4.3% |
| 56 | Milwaukee, WI | $1,000 | 3.1% | $1,170 | 14.7% |
| 58 | Colorado Springs, CO | $990 | 7.6% | $1,250 | 7.8% |
| 59 | Rochester, NY | $970 | 15.5% | $1,130 | 15.3% |
| 60 | Anchorage, AK | $960 | 5.5% | $1,180 | 2.6% |
| 60 | Kansas City, MO | $960 | 0.0% | $1,120 | 0.9% |
| 60 | Mesa, AZ | $960 | 4.3% | $1,190 | 3.5% |
| 63 | Cleveland, OH | $940 | 16.0% | $1,000 | 14.9% |
| 64 | Des Moines, IA | $930 | 14.8% | $990 | 15.1% |
| 65 | Norfolk, VA | $920 | 15.0% | $1,070 | 1.9% |
| 66 | St Louis, MO | $910 | 15.2% | $1,290 | 12.2% |
| 67 | Chattanooga, TN | $900 | 15.4% | $1,020 | 14.6% |
| 67 | Cincinnati, OH | $900 | 15.4% | $1,200 | 7.1% |
| 67 | Jacksonville, FL | $900 | -5.3% | $1,100 | 1.9% |
| 70 | Arlington, TX | $880 | 7.3% | $1,150 | 5.5% |
| 70 | San Antonio, TX | $880 | -2.2% | $1,100 | -1.8% |
| 72 | Glendale, AZ | $870 | 3.6% | $1,100 | 2.8% |
| 72 | Indianapolis, IN | $870 | 16.0% | $940 | 16.0% |
| 74 | Louisville, KY | $860 | -2.3% | $940 | -1.1% |
| 74 | Syracuse, NY | $860 | -11.3% | $1,060 | 1.0% |
| 76 | Omaha, NE | $850 | 1.2% | $1,020 | -2.9% |
| 77 | Bakersfield, CA | $840 | 13.5% | $1,070 | 15.1% |
| 78 | Corpus Christi, TX | $830 | -2.4% | $1,050 | -0.9% |
| 79 | Baton Rouge, LA | $820 | -1.2% | $940 | 1.1% |
| 80 | Columbus, OH | $810 | 15.7% | $1,050 | -1.9% |
| 80 | Knoxville, TN | $810 | 1.3% | $950 | 5.6% |
| 80 | Spokane, WA | $810 | 0.0% | $1,070 | 7.0% |
| 83 | Winston Salem, NC | $800 | 3.9% | $880 | 6.0% |
| 84 | Augusta, GA | $790 | 5.3% | $880 | 8.6% |
| 84 | Memphis, TN | $790 | 8.2% | $840 | 9.1% |
| 86 | Laredo, TX | $780 | -6.0% | $890 | 0.0% |
| 87 | Lincoln, NE | $770 | 14.9% | $920 | 3.4% |
| 88 | Tallahassee, FL | $760 | 0.0% | $900 | 2.3% |
| 89 | Albuquerque, NM | $750 | 7.1% | $900 | 7.1% |
| 89 | Lexington, KY | $750 | 0.0% | $950 | -3.1% |
| 89 | Oklahoma City, OK | $750 | 4.2% | $880 | 0.0% |
| 92 | Greensboro, NC | $720 | 1.4% | $840 | 1.2% |
| 93 | Detroit, MI | $700 | 14.8% | $800 | 15.9% |
| 93 | Tucson, AZ | $700 | 9.4% | $930 | 5.7% |
| 93 | Wichita, KS | $700 | 14.8% | $750 | 0.0% |
| 96 | El Paso, TX | $680 | 4.6% | $800 | 0.0% |
| 97 | Lubbock, TX | $650 | 3.2% | $840 | 7.7% |
| 97 | Shreveport, LA | $650 | 0.0% | $800 | 14.3% |
| 99 | Akron, OH | $610 | 10.9% | $730 | 0.0% |
| 100 | Tulsa, OK | $590 | -9.2% | $810 | 1.3% |