
Is the Nasdaq creating a look-alike pattern similar to the 2000 highs? Last month it did. Will the results be the same? Way too soon to tell!
This chart looks at the Nasdaq Composite Index over the past 25-years on a monthly basis.
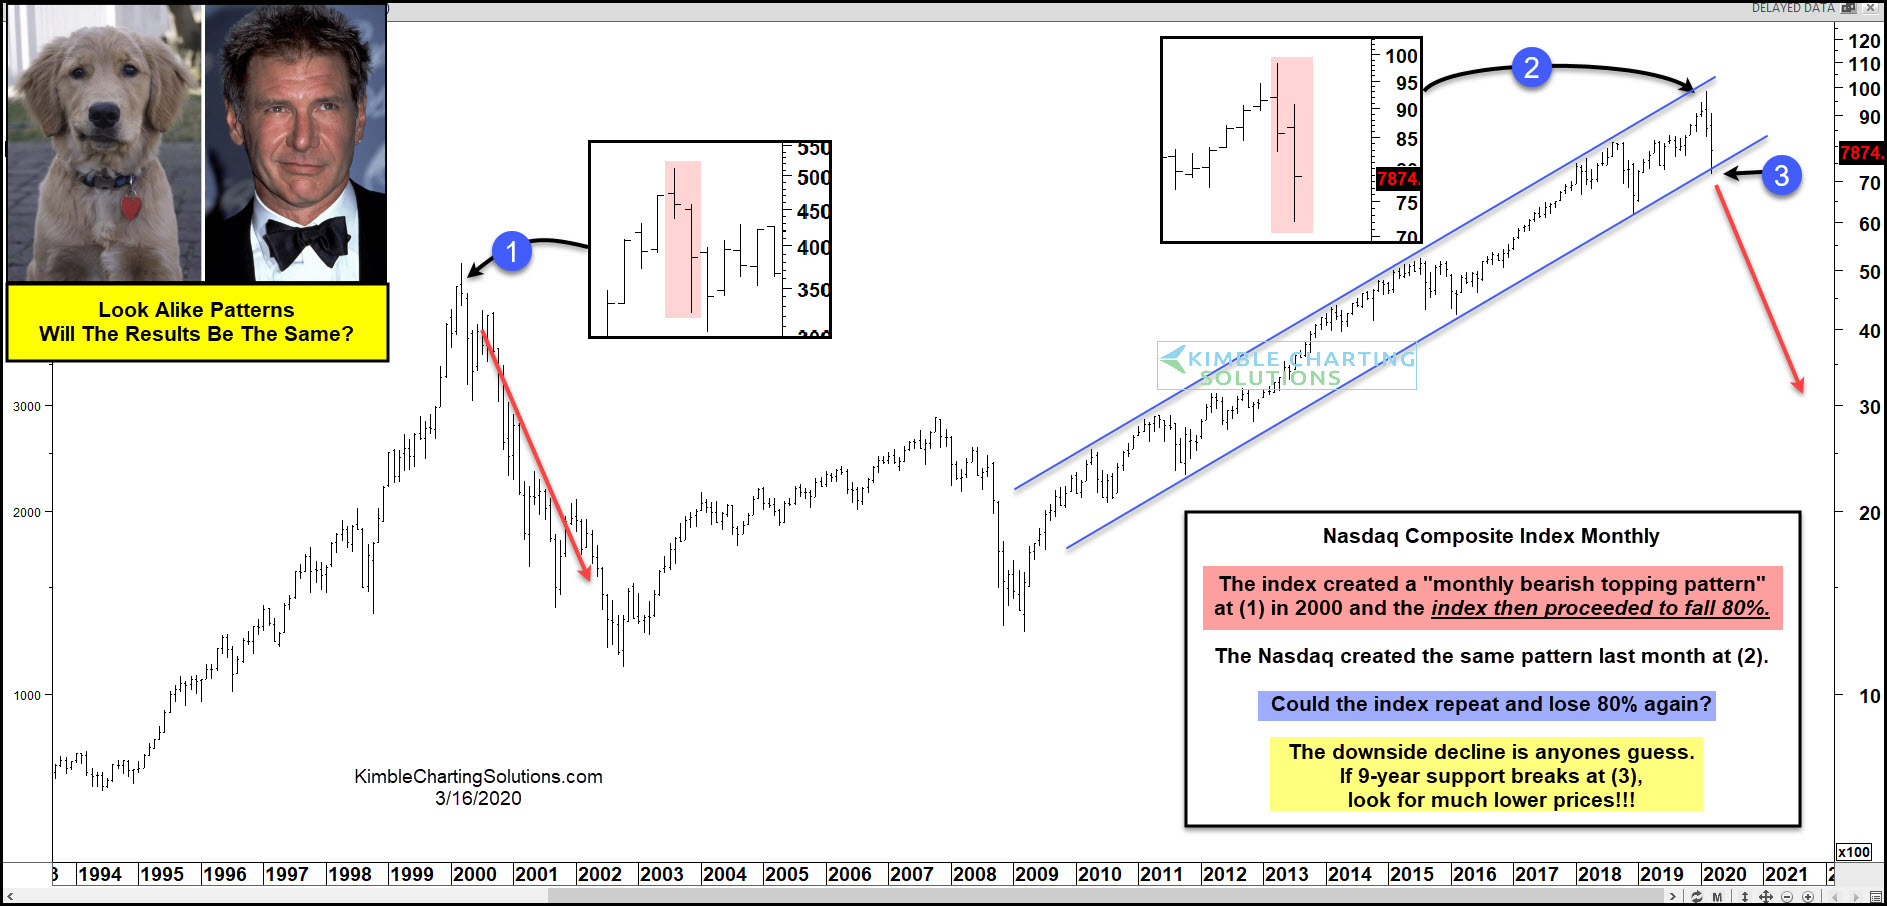
The index created a monthly bearish reversal pattern at (1) in 2000, then it proceeded to fall like a rock over the next couple of years, declining nearly 80%.
Turning the page forward 20-years, the index created a “look-alike bearish monthly pattern at the top of its 9-year rising channel at (2) last month!” Tech has sold off hard after creating the bearish pattern. Should the results be a big surprise? Not if one pays close attention to monthly patterns.
The decline this month has it currently testing the bottom of its 9-year support line at (3).
If the Nasdaq breaks support at (3), odds increase a good deal it will experience a great deal of selling pressure.
The first big support test for tech comes into play at the Monthly closing lows in December 2018 at 6,635. If this level happens to fail, the 2015 highs come into play at 5,146.
My humble advice, respect monthly bearish reversal patterns after strong multi-year rallies!!!