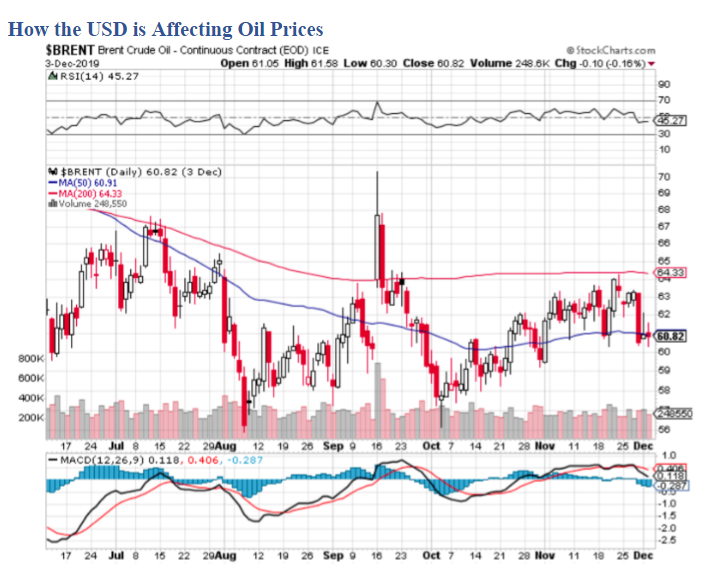
Source: StockCharts Brent Crude Oil Price
Brent crude oil is trading around $63 per barrel, while WTI crude oil (West Texas Intermediate) is hovering around $58.50 per barrel, both registering slightly bullish momentum in the final month of the year. The moderate gains in the price of crude oil since October have seen the price rising several dollars per barrel, although the current price is neck-and-neck with the 50-day moving average, and several dollars lower than the 200-day moving average price for Brent crude oil.
True to form, one of the most important technical indicators when trading crude oil is Bollinger Bands. These upper and lower bands register 90% of trading activity taking place with crude oil. When the price of crude oil is above the upper band, it indicates an overbought market and is reflective of downward pressure on pricing. This typically results in decreased demand, increased supply, and reduced prices.
Given that the bands are within close proximity to one another, it is clear that volatility has decreased recently. However, this simple moving average which takes place at 20 periods is an important indicator for oil traders. If the price closes above the upper band, you can expect oil price to weaken in coming trading sessions. Many of these technical strategies are employed by experts who trade oil with Plus500 and other leading commodities brokers.
Oil traders are advised to watch the upper band as very few closing prices should ever exceed the upper Bollinger Band. Most of the prices (intraday and end of day) should fall within the range of the lower band and the upper band, and are typically grouped around the Simple Moving Average line which is the center line. Breakouts occur when the price closes outside of the bands and corrections will invariably result.
While all crude oil is typically grouped together when discussions of this important commodity take place, there is a difference between WTI crude oil and Brent crude oil. WTI crude oil is trading at a lower price point than Brent crude oil ($58.50) with a 50-day moving average of $55.53 and 200-day moving average of $57.51. The recent bull market with crude oil has put some pep in oil prices, but that could reverse just as easily. Much like the Bollinger Bands for Brent crude oil, the band’s for WTI light crude oil have also tightened in recent days. However, it is unlikely that a breakout will take place just yet.
Performance of the USD and Crude Oil
The USD is up for the year-to-date against a basket of currencies, but only marginally so. Current USD weakness is evident against other major currencies like GBP. However, a strong US dollar serves as a disincentive to further gains in the oil price. The reason being – oil is a dollar-denominated asset. As the price of oil rises in USD, so other countries which purchase oil can afford to buy less per unit of their currency when converted into USD. The US dollar index is currently hovering around 97, with a 52-week high of 99 and a 52-week low of 95. Simply put, this indicates that the dollar has tapered off from its highs, but is still competitive enough on the international markets to warrant careful consideration.
The fact that the dollar strengthens and weakens against other currencies is important when it comes to vital commodities like crude oil. Countries that are particularly oil-rich like Canada, Saudi Arabia, Iran, Iraq, Russia, et al are affected more by dollar strength or weakness than countries like South Africa, Malawi, and Japan that have low stockpiles of crude oil. It should be noted that crude oil is a major determinant of inflationary pressures in the global economy. When oil prices rise, consumers have to pay more across the board. This was easily seen when crude prices were $100 plus per barrel, and inflation was steadily rising. Now that oil is trading in the $55 – $65 range per barrel, there is less of an effect on inflation, but it still needs to be watched.
Inflation, Deflation, and Oil Prices
When the price of crude oil drops in USD, countries that are oil-rich tend to suffer immeasurably. This can even cause a recession in those countries. When oil-rich countries bring in smaller USD-denominated receipts from exports of crude, this affects the GDP of the country, and ultimately places a squeeze on economic activity. Deflation is one of the most feared economic conditions, and the currencies of these countries tend to suffer significantly when oil prices decline. When prices move in the opposite direction, inflationary pressures become a reality. Government can guard against rising oil prices by subsidizing the cost for consumers. Ultimately though, it’s the consumers who pay the burden through increased taxes. This also places a squeeze on personal disposable income levels.
There is also another factor that is helping to keep oil prices in check – decreased demand by China. The US/China trade war has served to weaken the Chinese manufacturing juggernaut immeasurably. The currency (Chinese yuan) has weakened against the USD and this means that China is purchasing less crude oil to sustain its manufacturing enterprises. All in all, decreased demand by China will keep prices lower than oil producing countries would like. On the other hand, the reduction of oil supply by sanctions on Iran, and the destruction of Saudi Arabian oil production serve to balance the market out.
Disclaimer: This content does not necessarily represent the views of IWB.