The peaking process that the S&P 500 must go through after its 4th “Perilous Peak” since 1881 occurred in January 2021 is well underway. The S&P 500 must churn at the high to provide the fuel for the first double-digit correction since March 2020 to occur. After the required minimum correction has occurred the S&P 500 will fail to get back to its record high.
The index will instead begin its initial minimum Secular Bear market decline to an interim bottom and decline of 32% by 2023. The decline will then continue on until 2029. Investors should not wait for the decline to occur. My recommendation is for a Secular Bear market investing strategy to be effectuated as soon as possible.
My discovering a stock market’s Perilous Peak and also the DNA for a Perilous Peak begged for further clarification. Below are the dictionary definitions pertaining to a mountain peak:
- Peak: Point at the top of a mountain
- Summit: Highest point of a mountain
A perilous mountain peak is not defined by the mountain’s height. Its measured by the percentage of fatalities of those climbers who attempt to reach the mountain’s summit. Annapurna in central Nepal with a 33% fatal casualty rate is the most perilous peak in the world. However. It ranks as the 5th highest of the world’s top ten perilous mountain peaks. The world’s highest mountain, Mount Everest is the world’s 6th most perilous mountain peak. The US’ highest ranked perilous mountain peak is in New Hampshire. The “K2” ski brand was derived from the 3rd most perilous peak. For full details on 10 most perilous mountain peaks.
The date of the Perilous Peak’s occurrence is not necessarily a market’s highest point. A Perilous Peak for a stock index or market occurs only upon certain conditions happening. The table below contains the statistics for the three Perilous Peaks which occurred for the S&P 500 since its inception in 1871.
My recent ““DNA Discovery Confirms 2021 Perilous Peak & Secular Bull High for S&P 500” article was about a January 2021 record high for the S&P 500 possessing the DNA of a Perilous Peak. The two primary forces which drive a market to a Perilous Peak are extremes for valuation ratios and bullish sentiment.
The scaling of market peak is very similar to the scaling of a mountain. Experienced climbers are confident that they can scale the most perilous mountain peaks. Experienced investors are confident that stock market at a record high will go higher. In the end both suffer casualties.
Unlike the climbers, market professionals have a conflict of interest since they only receive fees per the assets they manage. Should a market professional advise a client to go to 100% cash for an extended period the professional can-not ethically charge the client a management fee. For this reason, a career advisor who does not have secular bear market investing experience must be accomplished at creating the spin to keep their clients or investors during the extended Secular Bear markets which follow a Perilous Peak.
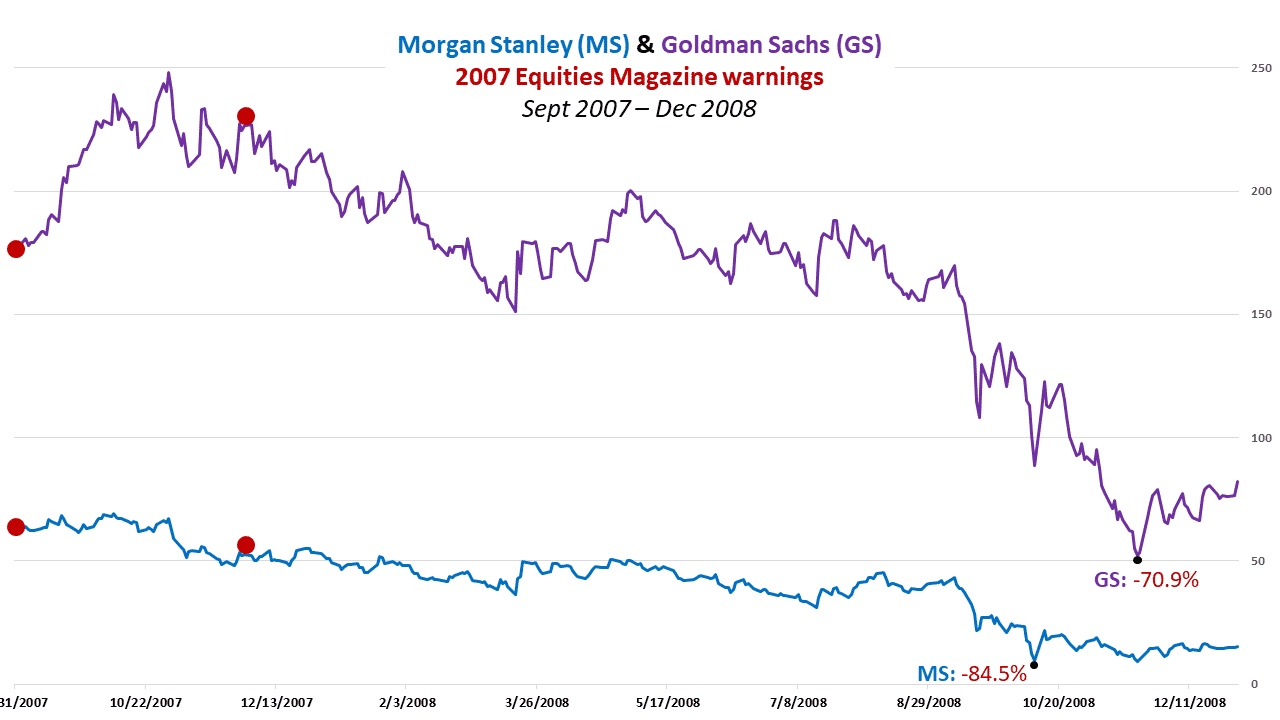
The last time my conviction level was as high for a prediction was in 2007. In this case, my prediction was for the collapse of the US’ five largest brokers. In my Equities Magazine’s September 2007 article, “Have Wall Street’s Brokers been Pigging Out?”, I emphatically warned to the readers to sell their holdings in Bear Stearns, Lehman, Merrill Lynch, Goldman Sachs, and Morgan Stanley. The snapshot below is from a page in that magazine.
Due to the price of Goldman Sachs shares increasing after the September 2007 warning, my December 2007 column, “Brokerages and the Sub Prime Crash” reiterated my emphatic warnings to sell the shares of the five brokers. During 2008, the five brokers would be catalyst to cause the Great Recession. Lehman filed for bankruptcy and by the end of 2008, only two of the five brokers were publicly traded. Morgan Stanley and Goldman Sachs only survived because they were rescued by Mitsubishi Finance ($9 billion) and Warren Buffet ($5 billion), respectively. From September 2007 to their 2008 lows, Morgan Stanley’s shares declined by 84.5% and Goldman Sachs by 70.9%.
My unrelenting conviction in 2007 as to the impending peril for the five brokers was the direct result of the deep empirical research that I had conducted in 2001 on Enron’s financials as well as the financials of hundreds of other public companies which had gone bankrupt unexpectedly from 1990 to 2000. The five brokers were diagnosed with the same condition that Enron had prior to its unexpected bankruptcy in 2001. Enron’s fall from grace was stunning for the following reasons:
- At 10/18/01, all 15 of Wall Street’s analysts rated Enron a “buy” and when it filed for bankruptcy in December 2001, there was only one sell rating.
- Fortune Magazine had named as “America’s Most Innovative Company” for six consecutive (1996-2001) years.
- Most importantly, as depicted in the chart below, Enron’s EPS was at an all-time high when it filed for bankruptcy.
I was compelled to conduct deep empirical research on the Financial Statements of public companies as a result of Enron’s demise. This led to my discovering Enron’s death knell, the flaw in its Financial Statements. This research led to the development of two algorithms that identify extremely unhealthy as well as those healthy public companies which have low relative valuations and share prices:
- EPS Syndrome (EPSS) – to predict bankruptcies for seemingly healthy public companies which are highly recommended by Wall Street analysts. A list of the companies which went bankrupt after an EPSS diagnosis, along with diagnostics for the five brokers, and a video about the EPSS are available at BullsNBears.com’s Perfect Shorts.
- OPS Rankings (OPSR) –ideal for finding the gems among the coals after a market has crashed or corrected significantly. In 2002, OPSR identified several dozen dot coms which had valid business models and which had survived the 2000 crash. They included Amazon, Yahoo, and eBay in Q4-02. The chart below depicts Amazon’s pre-2000 crash and Q4-2002 highs. Forbes 7/30/03 “Markowski Goes with the Flow” by Elizabeth MacDonald, now anchor on Fox Business TV Channel covers the performance of both algorithms.
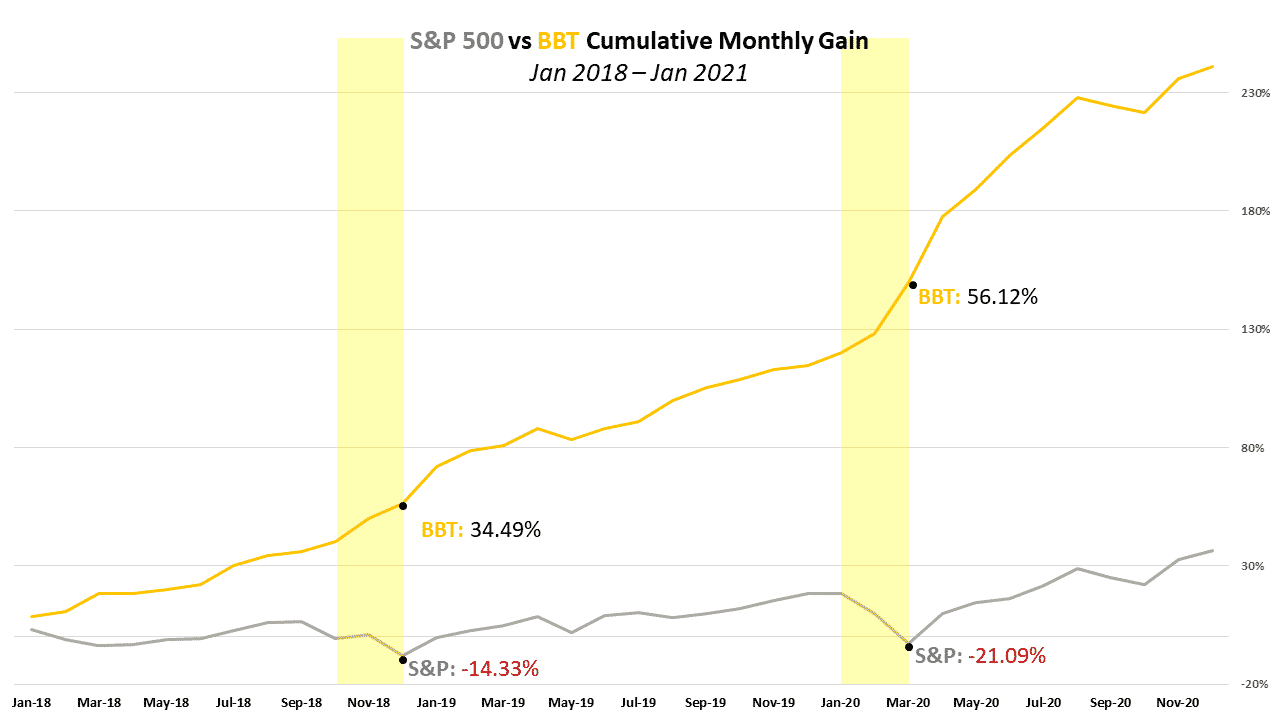
My conviction level for the BBT algorithm, arguably my most valuable, is also very high. The BBT evolved from my conducting deep empirical research of prior crashes and significant corrections. The BBT, which was originally developed to predict significant corrections and crashes, predicted the 2016 Brexit Crash. After being converted into a trend trader, BBT produced a gain of 204.4% vs. the S&P 500’s 36.6% for the three years ended December 31, 2020. Most importantly, as depicted in the chart below, the BBT produced gains for the S&P 500’s two worst quarterly declines. The BBT gained 34.5% for Q4-2018 and 56.1% for Q1-2020 versus the S&P 500’s losses of -14.3% and -21.1% respectively.
The discoveries and algorithms listed below are derived from the deep empirical research I conducted from November 2020 through the end of January 2021. The deep research protocol that I followed to make the discoveries, which evolved into algorithms, was the same that I utilized for the 2001 and 2016 discoveries. The EPSS algorithm which evolved from the 2001 Enron discovery was utilized to predict the 2008 debacle. The BBT algorithm which evolved from my 2016 discovery of the metric which precedes market corrections and crashes was utilized to predict the Brexit crash.
- Bullish Sentiment Anomaly (BSA), November 2020
- Bull Vix Algorithm (BVX), November 2020
- Perilous Peak, January 2021
- DNA for Perilous Peak/Secular Bull high, January 2021
- Greed Accelerator, January 2021
My conviction for the 5th Secular Bear Market for the S&P 500 since its 1871 inception to have begun in January 2021 is as high or higher than my conviction levels for prior predictions. This includes the predictions for the demise of the five brokers as well as that of the Brexit Crash. Below are my predictions through 2034 for the Secular Bear market of the S&P 500 which is now underway:
- to close lower at end of 2021, as compared to 2020 close
- to decline to a lower low in 2022
- to decline for a third consecutive year in 2023 and by a minimum of 32.2% from its 2020 peak
- to not reach its Secular Bear market low until 2029, at the earliest
- at Secular Bear market low will have declined by a minimum of 48.2%
- to not reach its 2021 high until 2034 at the earliest and 2045 at the latest
All investors and especially those who are above the age of 50 years, since the S&P 500 will not exceed its 2021 high until 2034 at the earliest, must effectuate a Secular Bear market investing strategy as soon as possible. As depicted in the next chart in this article below following a Secular Bull or buy and hold investing strategy will only produce losses during a Secular Bear market. If one’s investment advisor does not or can-not effectuate a Secular Bear investing strategy a change in advisors will be required. For more about Secular Bear investing strategies view 1:44 second video at bottom of this article.
The chart below depicts the performance of the Fidelity Magellan Fund, considered to be one of the world’s best-managed mutual funds during the 1982-2000 Secular Bull and the 2000-2009 Secular Bear markets.
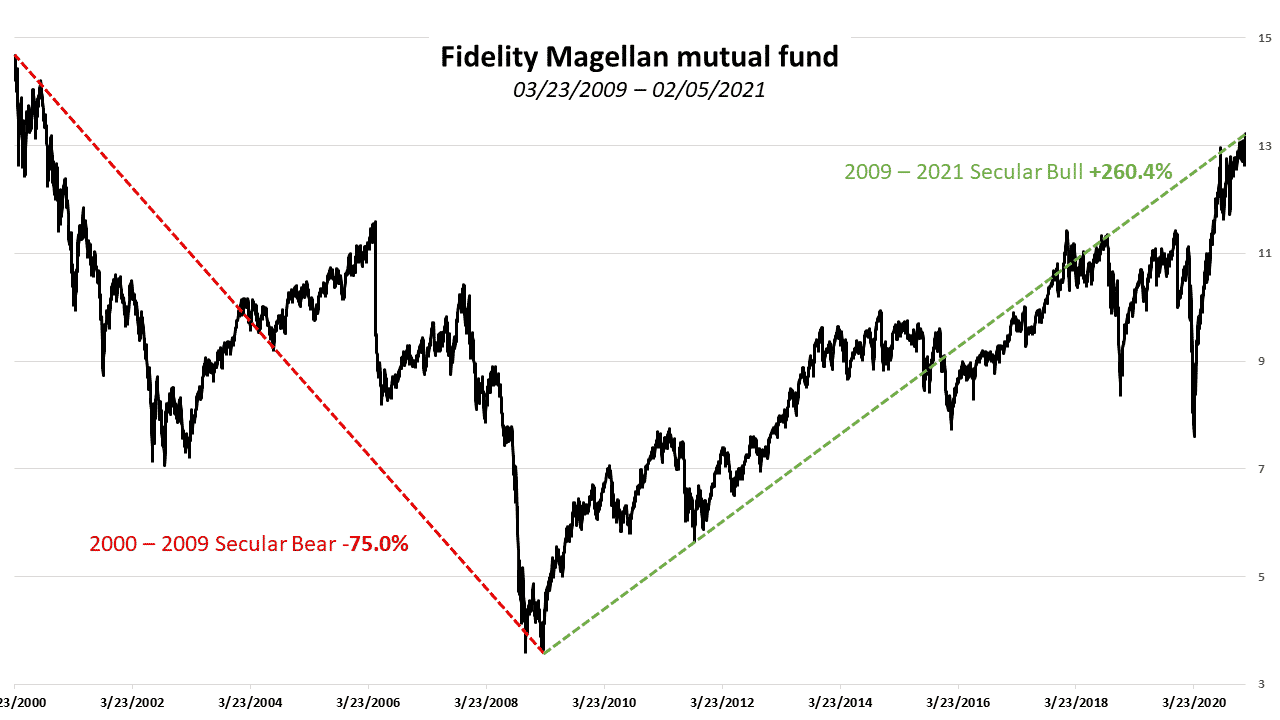
The chart below depicts the performance of the Fidelity Magellan for the 2000-2009 Secular Bear and 2009-2021 Secular Bull markets.
The bottom line is that both of the above charts depict the following:
- The stock market has secular (long term) upward and downward trends. Secular Bulls are followed by Secular Bears and then by Secular Bulls, etc. For a video about all Secular Bulls and Bears since 1920 click here.
- The majority of all investors including professionals and financial advisors can-not even maintain the price of a fund or the value of a portfolio during a Secular Bear market.
The big difference between a Secular Bull and a Secular Bear investing strategy is the proportion of an investment portfolio that is invested in small companies and penny stocks. A small company generally has a lower share price than a bigger company since it has yet to enter its accelerating growth period. A small company with a new product can grow in a stagnant economy by taking market share away from a big company competitor. Additionally, new technologies which are created by startups which reduce the cost of goods can enable a small company to take market share from a big company in a stagnant economy. The fish bowl below illustrates the advantage that a small company has over a big company.

When a Secular Bear market begins, which coincides with a Perilous Peak, savvy investors sell the shares of big companies and buy the shares of small companies. The chart below depicts what happens. For 2000 to 2002, the first two years of the 2000 to 2009 secular bear market the Royce Micro-cap Trust increased by 59%. Over the same period the big company only Dow Jones index declined by 19%.
There are two reasons why the vast majority of all investors lose money during a Secular Bear market:
- unaware of the small versus big phenomenon
- unable to invest some or all of their money into small companies
As depicted in the table below at December 31, 2020 the aggregate value of the US stock market was $35 Trillion.
The reason why professionals like Fidelity Magellan lose money during a Secular Bear markets
- Prohibited from selling 100% of big company shares and investing 100% of proceeds into small company shares. Smaller companies are inherently riskier.
- Limited supply of small company shares at reasonable prices.
Due to the above its impossible for a stock market’s ownership ratio or constitution to ever go from 90% big companies to 90% small companies. The dilemma for a large investor is they can-not invest 100% of their money into small companies. The ownership ratio dilemma is the secret as to why the stock market has been and will forever be secular.
To summarize, the supply of small company shares at reasonable prices is limited from the beginning to the end of Secular Bear market. To capitalize from the inherit and extremely lucrative supply and demand imbalance requires that a Secular Bear market investing strategy be effectuated as soon as possible.
AlphaTack.com was established for Secular Bear market investing. View 1:44 seconds video below about Alpha Tack which provides Secular Bear market investing strategies and also referrals to experienced advisors who utilize such strategies:


