by Econimica
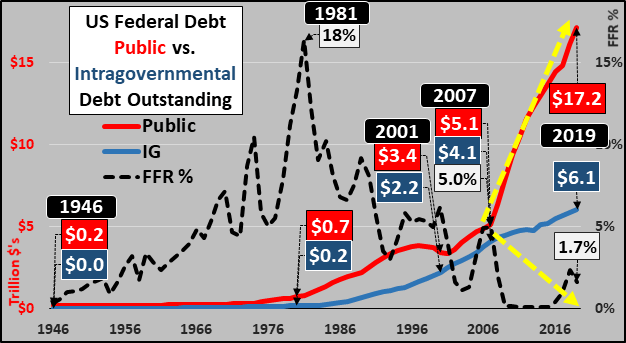
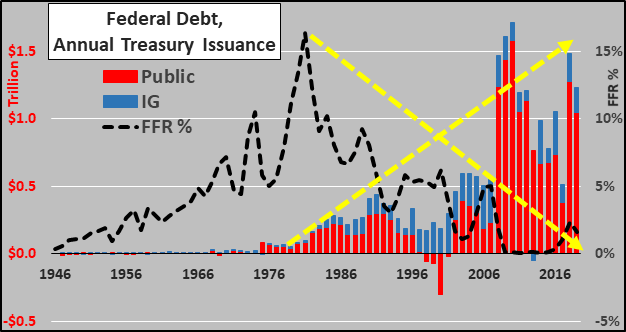
Since 2007, marketable federal debt has exploded while Intragovernmental debt has relatively gently rose…all while the Federal Reserve directed Federal Funds Rate has been pushed to zero. And another push to ZIRP is almost surely in process or even a furtherance, moving into NIRP and the paying of lenders to undertake loans. But why?
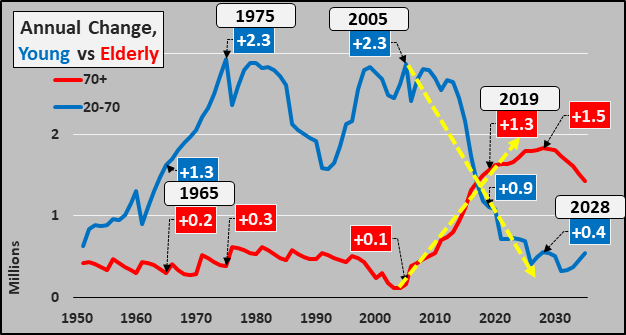
From 1965 to 2005, the annual growth of the 70+ year old US population ranged from 100,000 to 300,000 while the growth of the working age population (20 to 70) ranged from 1.3 million to 2.3 million. Obviously, I put the big yellow arrows on the chart below to indicate where the reversal began and that it will only become more acute and for well over another decade or two before the trends may begin to reverse again (though primarily the growth of the elderly will decelerate but the collapsing birth rates and decelerating immigration are telling us there will be little to no uptick in growth of the working age population). Think of it this way, the working age population creates money by undertaking loans (debt) while the elderly destroy money by paying down or paying off loans (deleveraging). So long as there was significantly more growth among working age than elderly, money creation was positive. But obviously now, the poles have reversed and the deleveraging, relatively low consuming, fixed income elderly are the majority of annual population growth. The working age growth is diving and likely to be even lower than the overly optimistic UN estimates shown below (relying heavily on higher immigration rates than are currently taking place).
Below, surging annual federal debt as the Federal Funds Rate went from 18% to zero…and Federal debt from $1 trillion to the present $23+ trillion. The deceleration of private debt growth and acceleration in Federal and corporate debt have everything to do with demographics and the reactionary zero interest rate policy…soon to be negative interest rate policy.
Putting the federal debt into perspective. I divide the by the 20 to 70 year old US population by the Federal debt since 1950. In 2019, every American from 20 to 70 year-old is currently responsible for $110,000 in federal debt…up from $6,000 in 1980, $33,000 in 2001, and $49,000 in 2007. However, if all the unfunded liabilities were included, the shape of the curve would be similar but the dollar amounts per capita would increase by 5 to 10 times. Noteworthy, wages have been nowhere close to keeping up with this rising liability. As for rising household wealth (stocks, RE, bonds, etc.) these asset values are illusory and not supported by relative growth in wages (also known as “a bubble”).
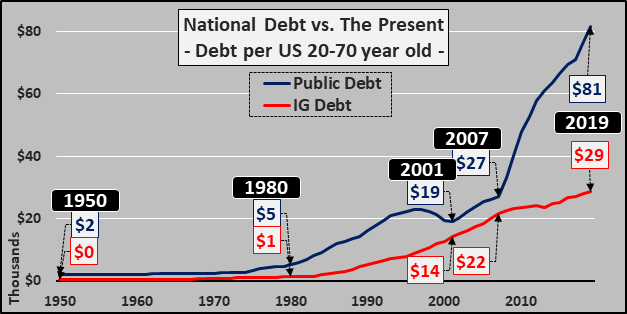
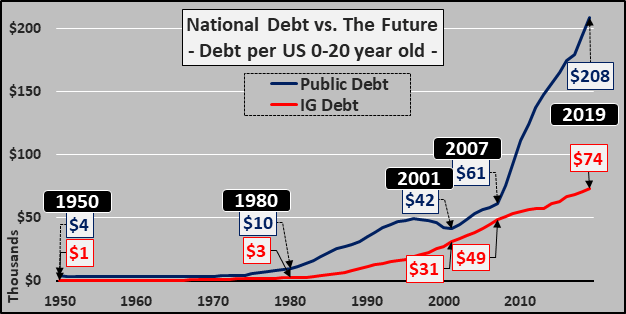
Again putting the debt into perspective but against what the present has saddled the future with. This time, the debt is divided by the 0 to 20 year old US population (below). Every American under 20 years-old is currently liable for $282,000 in federal debt…up from $13,000 in 1980, $73,000 in 2001, and $110,000 in 2007. And with debt skyrocketing and the under 20 year-old population continuing to decline…a parabolic move is underway.
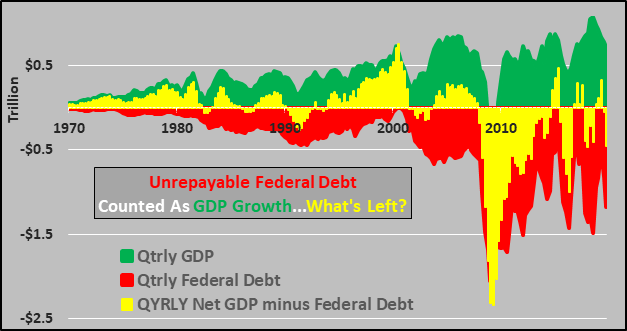
What about the idea of outgrowing the debt? First, federal debt spending is counted as part of GDP growth but there is no subtraction for when the debt is to be repaid or serviced in perpetuity. Anyway, in an attempt to see actual GDP growth absent federal deficit spending, below is quarterly GDP growth (green columns) versus quarterly federal debt growth (red columns) and what remains once you back out the new federal debt from the GDP growth (yellow columns) through 2019. To finish 2019, I use the Atlanta Fed GDPNow estimate of 0.4% for Q4 as well as an estimate that the Treasury will “only” add another $150 billion net new debt by year end, finishing at $23.2 trillion. I say “only” because the Treasury has issued over $1 trillion in net new debt over the past 3+ months since August 1st and the deluge shows no signs of slowing.
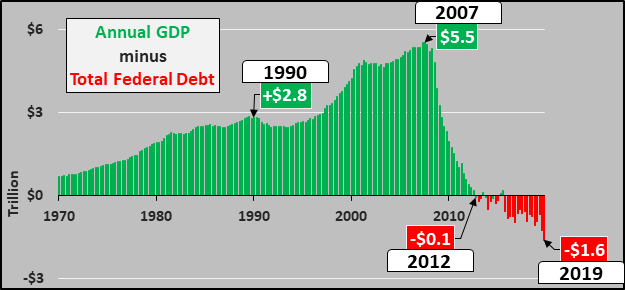
If we track the real growth of GDP minus the boost of federal debt (which must be repaid or serviced ad infinitum), we get the chart below. Simply put, organic US economic activity is declining and it is only ever greater unrepayable and ultimately unserviceable federal deficit spending providing the appearance of growth.
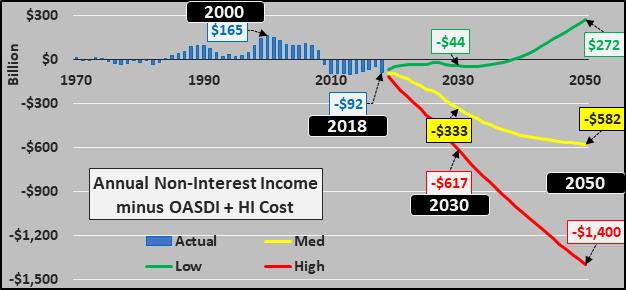
One of the primary drivers of this growing deficit spending is charted below. The annual surplus of tax revenue among Social Security and the like (OASDI) and Medicare / Medicaid (HI.) peaked in 2000, turned negative in 2009…and is set to most likely follow the Treasuries worst case red line scenario. What was an annual surplus of up to $165 billion, which was mandated by law to buy US Treasury debt, will be well over a deficit of $100 billion in 2019 and surge to an annual deficit of $300 to $600 billion by 2030. This means what was a buyer of nearly half of US debt until 2007 has turned into a massive need for significantly more issuance just to make up the shortfall.
And this leads me to direct monetization of the debt. In 2009, the Federal Reserve undertook the large scale purchasing of Treasuries and Mortgage Backed Securities. But simultaneously, the Fed encouraged (or mandated…I’m really not sure which) that most of the money digitally conjured to buy these assets would be deposited at the Federal Reserve. This would keep the new money “inert” and not allow the fresh digital dollars, where assets had been, to be levered into the economy or markets…also known as “direct monetization”. As the chart below details, the growth of the Fed’s balance sheet (in blue) was generally matched by growth of bank excess reserves (red line) through the end of QE. The differential or “direct monetization”, shown in yellow, was somewhat stable during this period.
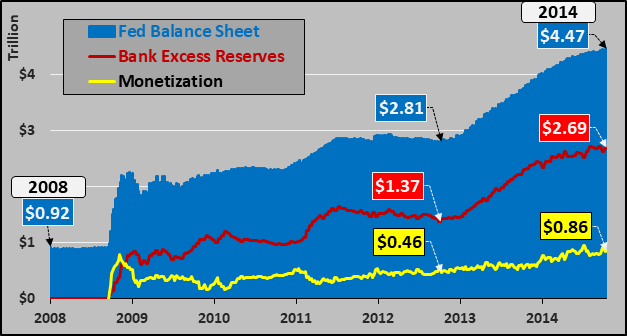
But very importantly, since QE ended in Q3 2014, excess reserves have been consistently declining faster than the Fed’s balance sheet…with the outcome of rising direct monetization. Since QE ended, nearly a trillion freshly conjured dollars have subsequently been levered by 5x’s or 10x’s (or who knows how many times) boosting asset prices.
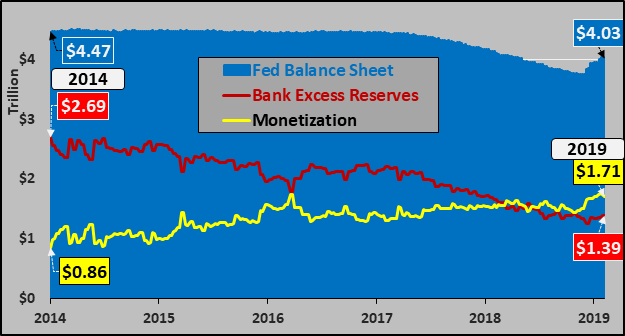
But the most recent about face by the Fed to begin QE4 (or “not-QE”, as the Fed has termed it this time) has not been matched by rising bank excess reserves. In fact, if the Fed is to attempt to avoid “direct monetization”, as they have claimed they would never do this, the Fed has a huge problem. As the Fed is cutting interest rates to incent economic (financial?) activity, the same action is disincentivizing banks from holding excess reserves, as the billions in interest for making no loans and taking no risks are going away.
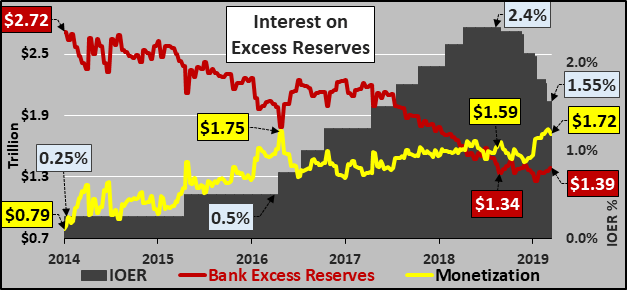
Now, of course, if the Fed’s goal is to monetize the debt, the continued growth in the Fed’s balance sheet, continued cuts in the Federal Funds rate (shadowed by cuts in Interest on Excess Reserves) will drive ever more of the freshly conjured digital dollars into the “market” with who knows how much leverage. Ever fewer assets with ever more dollars chasing the remaining assets, the final “big squeeze”. Again, the Fed said they would never do this…but as infamous modern central bankers have said, “when it becomes serious, you have to lie”. I expect there will be few winners and many losers as this final “big squeeze” plays out. But I do suppose the few, private, and undisclosed owners of the Fed will somehow be among the winners.