
The following is a complementary look at some of the evidence behind our recommendation to TLS members to trim some of their recently added long exposure.
The so-called “risk-on” move in stocks continues, with the market building on gains made since we issued our “once a decade” short-term buying opportunity a few weeks ago. However, while the risk-on bounce certainly may have further to go, the evidence is starting to pile up in favor of at least reducing some long stock exposure at this juncture. Some of that evidence relates to various “risk indicators” tied to the stock market that we like to monitor.
As we have mentioned in the past, in analyzing risk in the market, we predominantly rely on quantitative models that we’ve developed over the years. However, there are other indicators that we’ve found helpful in instructing us as to the “risk-on” vs. “risk-off” situation in the market, including high yield bonds, high-beta stocks and small-cap pure value stocks. These indicators can provide helpful clues as to the potential strength or durability of market rallies.
For example, in mid-August, we noted the following regarding the gathering risk being signaled by these indicators.
“Taking stock of the combination of these 3 “risk-on/risk-off” measures, we find adequate reason for some concern. There are certainly enough positives in the market to maintain moderate long exposure to stocks. Furthermore, the broad market would appear to be setting up for a breakout to new highs. However, given the status of these risk indicators, an aggressive play on the potential breakout is probably not warranted. Furthermore, should the broad market break out, and these risk measures fail to follow along, it could be an indication of a likely failed, or temporary, breakout.”
Indeed, the broad stock market would break out to new highs in the final days of August — and immediately fail from there. The failure would, of course, precipitate the sharp fall selloff.
In late November, we shared another post assessing the message behind the behavior of these risk indicators. While stocks had already sold off a significant amount, our conclusion based on poor action in these risk indicators was that further downside was likely prior to a substantial low:
“While the stock market correction has certainly wrung out some of the excess risk that we were warning about in late summer, it does not appear to be enough to yet lay the foundation for an intermediate-term low and a new durable rally. The status of the 3 key risk indicators above each indicate a continued elevated level of risk in the stock market at this time. Therefore, our focus would not yet be on significantly increasing equity exposure in anticipation of an impending successful re-test of the October low. Rather, we will continue to be more focused in the near-term on reducing exposure, or hedging into any near-term market strength.”
Obviously the market plunge would continue — and even accelerate — throughout the month of December.
The first signs of life from the risk indicators occurred early this year as the market was attempting to find a bottom. Often it begins with some resilience in these measures, even in the face of overall market weakness. We tweeted evidence of that resilience during the first 2 days of the year when the market gapped down hard on consecutive days, yet the risk indicators held up well:
Sure enough, that resilience led to a 3%-4% jump in stocks the next day — and a continued rally since.
So what message are these risk indicators signaling now? Well, as we said, while the market can certainly continue its rally — especially given how washed-out it got — the prospects of adding significant risk at the current time are not nearly as attractive as they were just a few weeks ago. In fact, given the proximity of prices on each of the risk indicator charts, it seems an opportune time to remove some equity risk — in particular, if you added aggressively a few weeks ago. Here’s what we’re looking at.
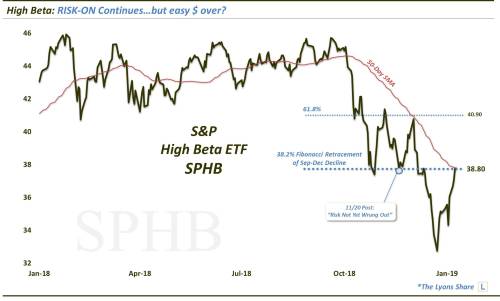
High-Beta: (Status: RISK ON…but hitting resistance)
We normally focus on the “high-beta” area of the market in relation to the “low-volatility” area. At the moment, that ratio is still in a downtrend, signaling risk-off. However, on an absolute basis, high beta, as measured by the Invesco S&P 500 High Beta ETF (SPHB), has been on a solid run. It is some 15% off of its late December low.
That run, though, has brought it up to several layers of potential resistance near the 38.80 level, including:
- The 38.2% Fibonacci Retracement of its September-December Decline
- Its 50-Day Simple Moving Average
- The Breakdown Level of its former lows from October-December
This might not be the end of the high-beta bounce — but this level very well could cause a temporary pause. Thus, it is a good spot, in our view, to remove some long exposure here.
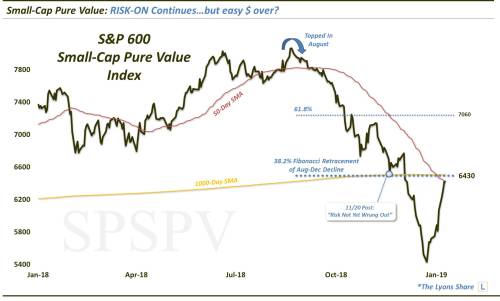
Small-Cap Pure Value (Status: RISK ON…but hitting resistance)
When it comes to market “styles” (e.g., small, mid, large-cap and growth vs. value), the small-cap pure value style traditionally has the highest beta. And like the “high-beta” stock segment mentioned above, the S&P 600 Small-Cap Pure Value Index (SPSPV) typically leads the way in a legitimate risk-on market rally — and lower in a risk-off move. For example, the SPSPV led the market drawdown, first by topping in August, then with its relentless plunge.
Like the high-beta space, though, it too is enjoying a huge bounce — close to 20%, in fact, from its December low. However, it also is testing several layers of potential resistance near the 6430 level, including:
- The 38.2% Fibonacci Retracement of its August-December Decline
- Its 50-Day Simple Moving Average
- Its 1000-Day (200-Week) Simple Moving Average
Again, while this resistance doesn’t have to be the death-knell of this bounce, it does signal to us a prudent spot to take some profits in this area as the going may get a bit tougher from here.
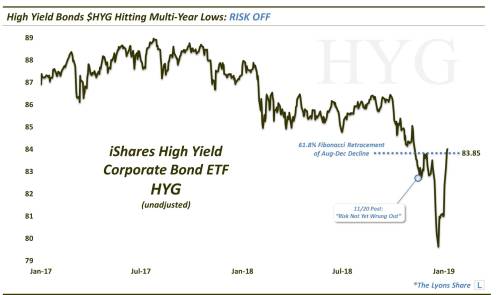
High Yield Bonds (Status: RISK ON…but hitting resistance)
Lastly, we have the high yield bond market. As high yield represents the riskiest of all bonds, the space actually trades in concert with equities much of the time. Thus, when high yield bonds are rallying, it is indicative of risk-taking, which generally includes a rallying stock market. That has been the case over the past few weeks, following a relentless autumn decline that hardly paused until the late December lows. As measured by the iShares High Yield Bond ETF (HYG), the space is up over 5% in just 2 weeks, an enormous move for high yield bonds.
However, like the prior 2 indicators, the HYG is also encountering potential resistance near the 83.85 level, including the important 61.8% Fibonacci Retracement of its August-December decline.
If you happen to be long this space, it makes sense to us to de-risk, or remove some exposure here as well.
*Bonus*: VIX (Status: Testing support)
While the volatility market isn’t necessarily one of the “risk indicators” that we track, it certainly can be useful in gauging appropriate risk. Presently, the S&P 500 Volatility Index, or VIX, is testing what may be key support near 20 in the form of the 61.8% Fibonacci Retracement of its August-December rise (stock volatility expectations generally move opposite price).
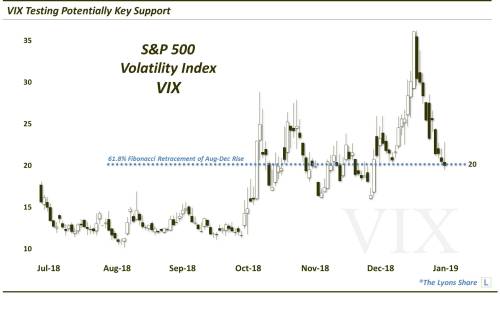
Should the VIX hold here, at least temporarily, it could signal at least a pause in the stock market bounce.
Aggregate Conclusion: RISK ON — but take some off
The stock market may well continue in the short or intermediate-term. However, to the extent that there was “easy” risk-on money to be made at the late December lows in the market — that has likely been realized. The proximity of the risk indicators suggest that the going may get tougher for stocks from here. Thus, while it doesn’t mean that we need to completely switch to risk-off mode, it does make sense to at least dim the risk-on levels a little bit here.