The Russell 2000 Index (RUT) has lagged the broader S&P 500 Index for much of the recovery rally off the March lows.
But recently, the small caps stocks index has joined the fun. But the question is, can it last?
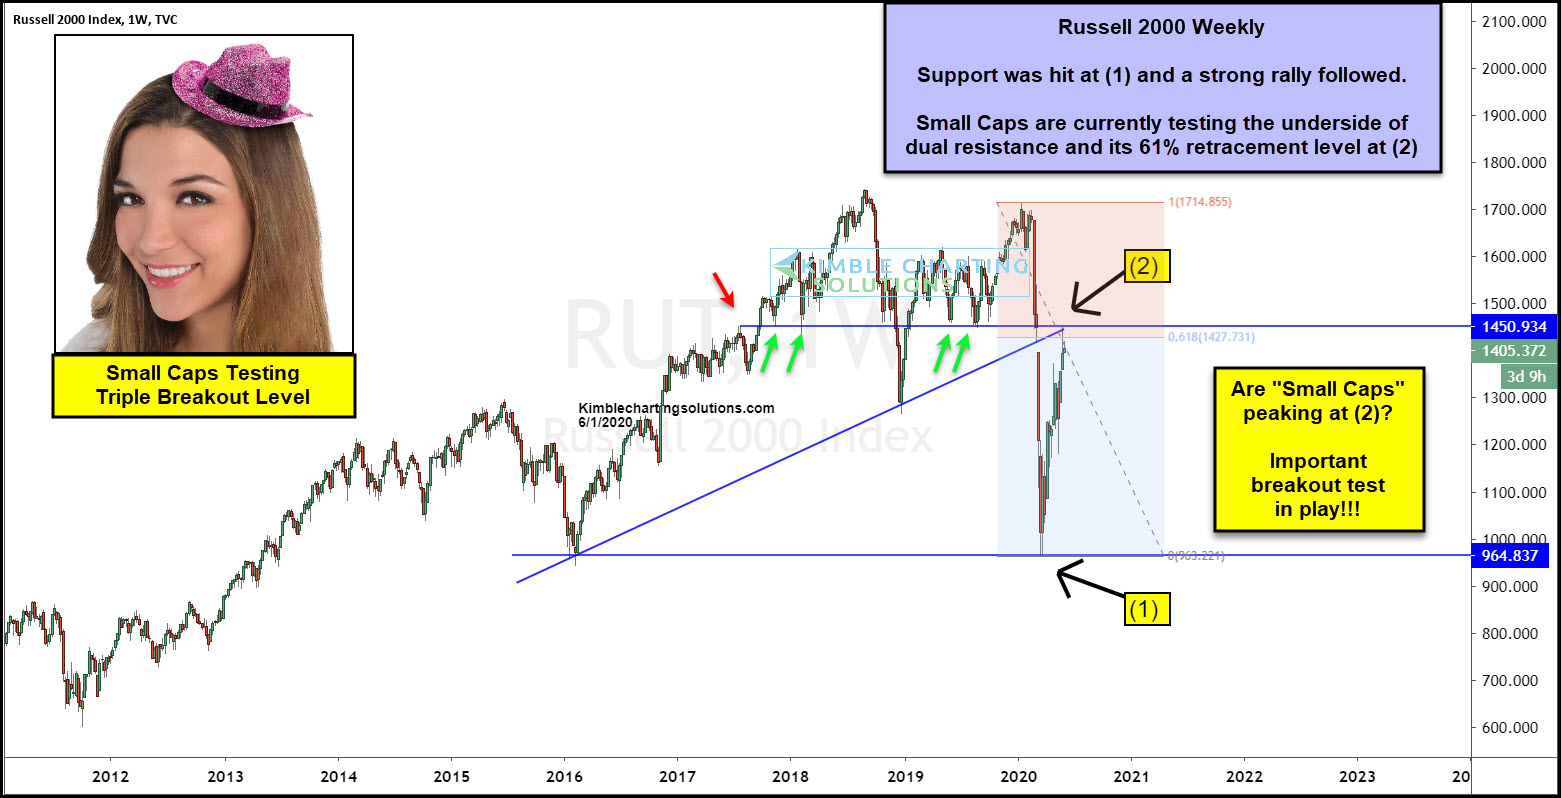
In today’s chart, we highlight a very important level to watch on the Russell 2000.
As you can see, the index is rallying right into triple resistance at (2), marked by a broken up-trend line, 61.8 Fibonacci price level, and former support (see green arrows).
Could the small caps rally peak out at (2)? Or breakout? There is a potential inflection point in play.
If small caps succeed in breaking out at (2), look for the to outperform large caps for a while!