Pretty much any indicator mainstream investors look at (for example earnings) will look good at tops. There are lots of things about the current environment that look good but if you look at what a big top looks like this is it. Investors are extremely bullish and positioned accordingly. Borrowing is easy regardless of your credit rating and the economy is humming along (if you ignore the underlying rot).
So a top is something of a paradox, things look great and terrible at the same time. Perhaps the one indicator that really is actually out of line with an impending recession and bear market is the yield curve. An inverted yield curve is perhaps the most reliable indication of an impending recession but we don’t have it. I don’t know if that is because of the interest rate environment this time around (because Japan has experienced the same thing before), or if the yield curve will actually invert at some point.
look at this chart of earnings.
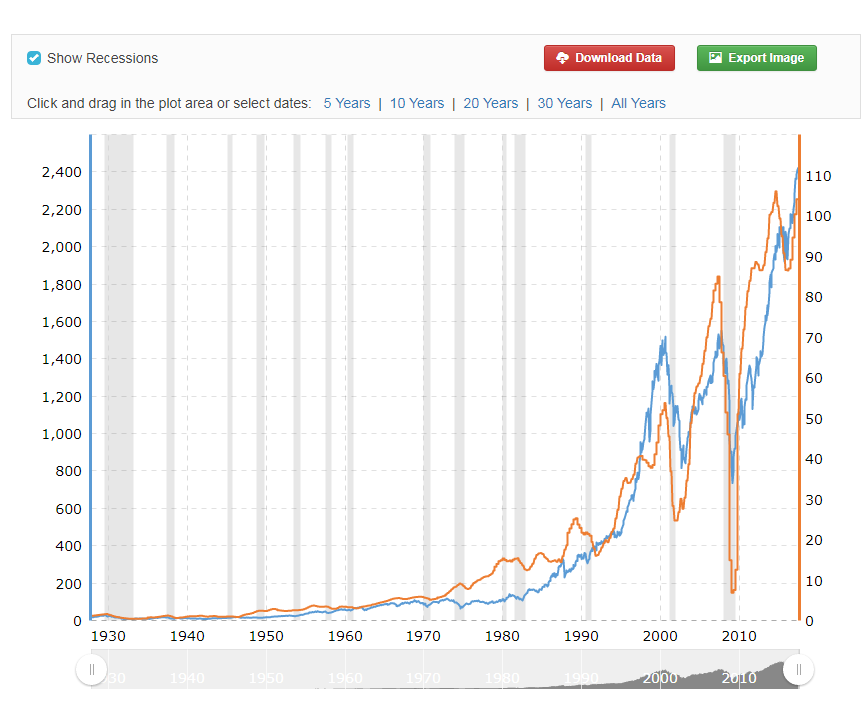
http://www.macrotrends.net/1324/s-p-500-earnings-history
Lehman brothers went bankrupt on Sept 15th and a lot of people reference that date, it took a couple more weeks for shit to really hit the fan.
https://www.google.com/search?q=tlt&oq=tlt&aqs=chrome..69i57.343j0j1&sourceid=chrome&ie=UTF-8
If this spikes upward again it’ll serve as a good warning of a big drop in the stock market
h/t SpontaneousDisorder