Stocks are now on the edge of a cliff.
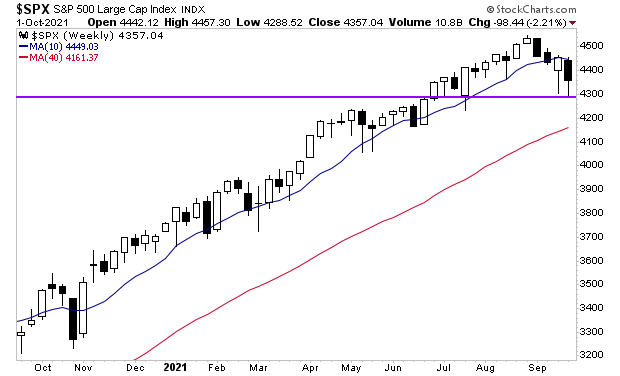
The S&P 500 broke below its 50-DMA two weeks ago. It has since failed to reclaim this line. That is the first time this has happened this year.
The good news is that 4,300 (purple line in the chart below) served as support last week for the market. But if the bulls cannot rally here and now, we’ll likely see a drop to the 200-DMA (currently at 4,161).
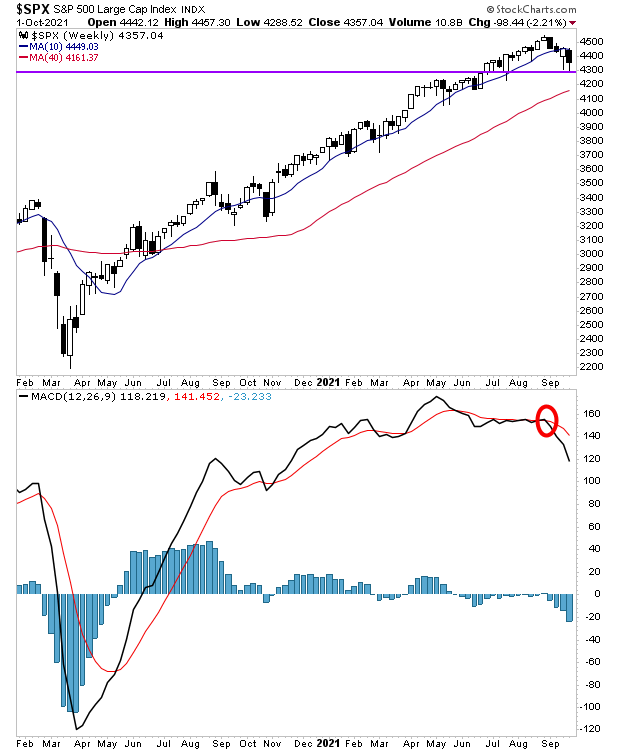
To make matters worse, the weekly MACD is on a “sell signal” (red circle in the chart below). You’ll note that this sell signal is quite different from previous signals in its depth and violence.
And finally, as of Friday, we had a new slew of weekly candles. Not one sector of the S&P 500 is in an uptrend. At best we have one that might be in an uptrend. The other 10 sectors are all in confirmed downtrends, meaning over 87% of the market’s weighting is in downtrends.
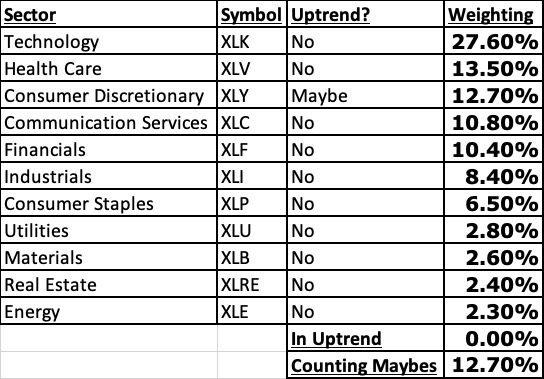
This is all REALLY bad news. With this much of the market’s weight in downtrends, the door is open to some REAL fireworks!
This has many investors asking…
IS A CRASH ABOUT TO HIT!?!?
To figure this out, I rely on certain key signals that flash before every market crash.
I detail them, along with what they’re currently saying about the market today in a Special Investment Report How to Predict a Crash.
To pick up a free copy, swing by
https://phoenixcapitalmarketing.com/predictcrash.html
Best Regards