At the beginning of this year, I was at dinner with my wife. Sitting at the table next to us, was a young financial advisor, who was probably in his mid-30’s, meeting with his client who appeared to be in his 60’s. Of course, the market had just experienced a 20% correction from the previous peak and the client was obviously concerned about his portfolio.
“Don’t worry, there is always volatility in the market, but as you can see, even bear markets are mild and on average the market returns 8% a year over the long-term.”
Here is the chart which shows the PERCENTAGE return of each bull and bear market going back to 1900. (The chart is the S&P 500 Total Return Inflation-Adjusted index.)
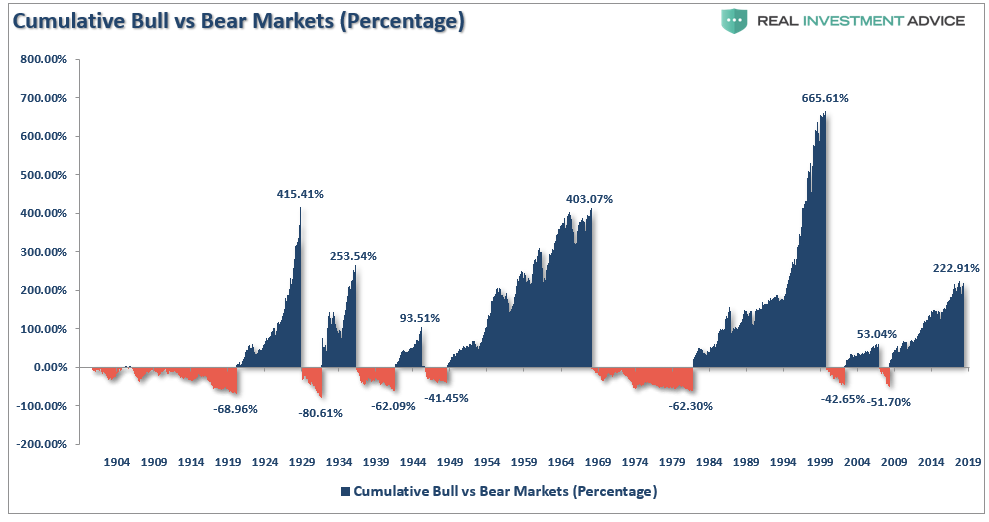
Here is the narrative used with this chart.
“The average bear market lasts 1.4 years on average and falls 41% on average.-The average bull market (when the market is rising) lasts 9.1 years on average and rises 476% on average.”
While the statement is not false, it is a false narrative.
“Lies, Damned Lies, and Statistics.”– Mark Twain
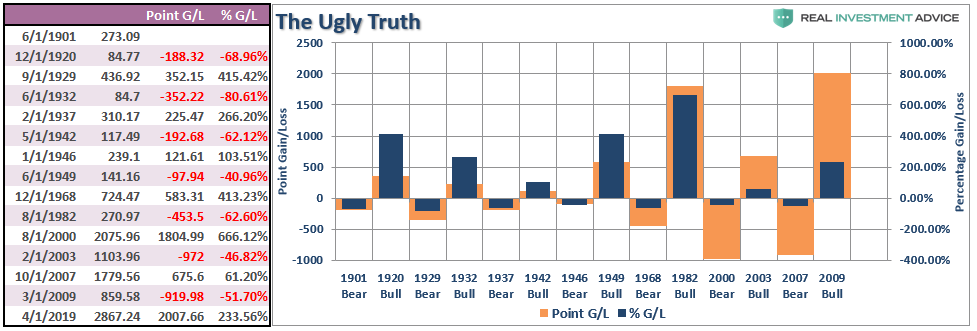
Here are the basics of math.
- If the index goes from 100 to 200 it is indeed a 100% gain.
- If the index goes from 200 back to 100, it is only a 50% loss.
- Mathematically it would seem as if an investor is still 50% ahead, however, the net return is actually ZERO.
This is the error of measuring returns in terms of percentages as it masks the real damage done to portfolios during a decline. To understand the real impact of bull and bear markets on a portfolio, it must be measured in POINTS rather than percentages.
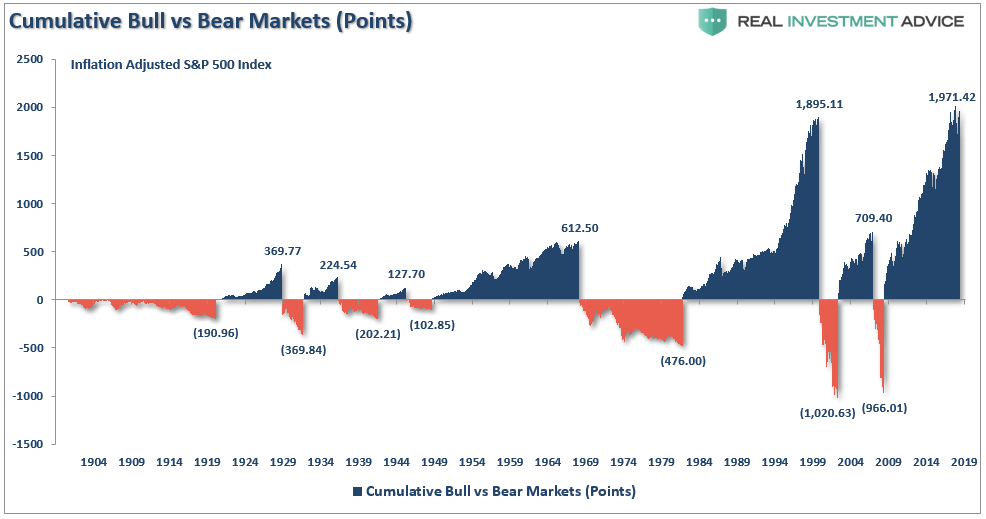
The chart above exposes the basic realities of math, loss, and time. What becomes much more apparent is that bear markets tend to destroy most or all of the previous advance and has done so repeatedly throughout history.
Importantly, what was not being discussed between the advisor and his 60-something client was simply the risk of “time.”
There are many financial advisors, commentators, experts, and social media gurus who have never actually “been invested” during a real “bear market.” While the “theory of ‘buy and hold’” sounds good, kind of like MMT, in practice it is an entirely different issue. The emotional stress of loss leads to selling even by the most “die hard” of individuals. The combined destruction of capital and the loss of time is the biggest issue when it comes to individuals meeting their retirement goals.
The following chart the real, inflation-adjusted, total return of the S&P 500 index.
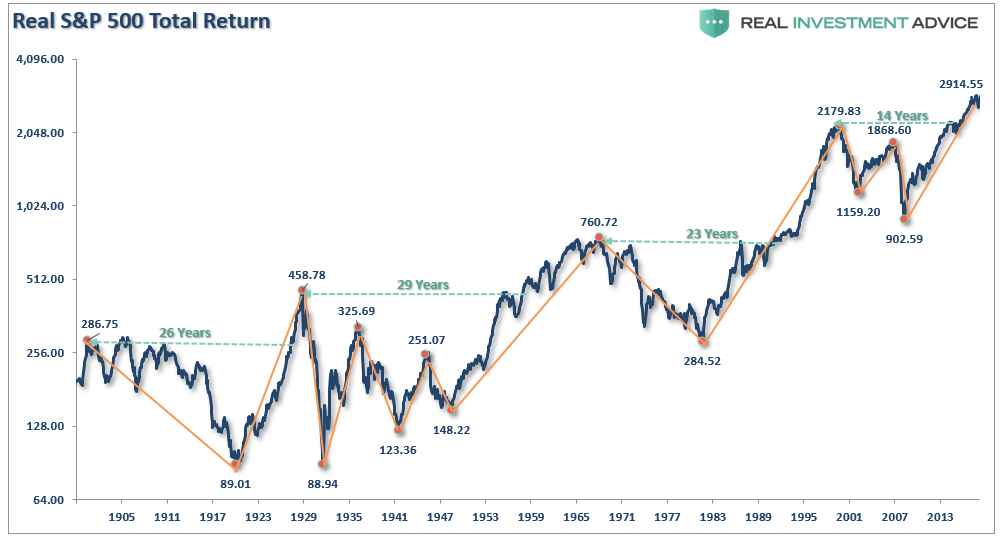
Note: The green lines denote the number of years required to get back to even following a bear market. It is worth noting the entirety of the markets return over the last 118-years occurred in only 4-periods: 1925-1929, 1959-1968, 1990-2000, and 2016-present)
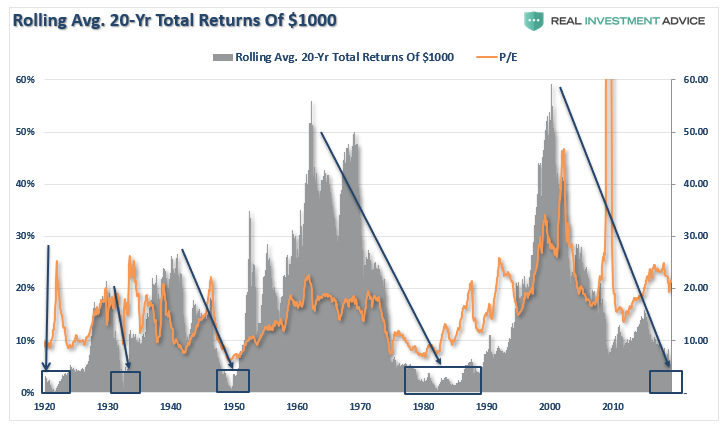
That comment corresponds to the next chart. As noted, there have currently been four, going on five, periods of low returns over a 20-year period.
As discussed last week:
“Unless you have contracted ‘vampirism,’ then you do NOT have 90, 100, or more, years to invest to gain “average historical returns.” Given that most investors do not start seriously saving for retirement until the age of 35, or older, they have about 30-35 years to reach their goals. If that period happens to include a 12-15 year period in which returns are flat, as history tells us is probable, then the odds of achieving their goals are severely diminished.
What drives those 12-15 year periods of flat to little return? Valuations.
Just remember, a 20-year period of one-percent returns is indistinguishable from ZERO with respect to meeting savings goals.”
In other words, the most important component of your investment success depends more on WHEN you start rather than IF you start.
That brings me to my second point of that nagging problem of “time.”
Time Is An Unkind Companion
While it is nostalgic to use 100+ years of market data to try and prove a point about the benefits of “buy and hold” investing, the reality is that we “mere mortals” do not have the life-span required to achieve those returns.
“Despite the best of intentions, a vast majority of the ‘bullish’ crowd today have never lived through a real bear market.”
I have been managing money for people for a very long time. The one simple truth is that once an individual has lost a large chunk of their savings, they are very reluctant to go through such an experience a second time. This is particularly the case as individuals get ever closer to their retirement age.
Let’s remember that our purpose of investing is to:
“Grow savings at a rate which maintains the same purchasing power parity in the future and provides a stream of living income.”
Nowhere in that statement is a requirement to “beat a benchmark index.”
For most people, a $1 million account sounds like a lot of money. It’s a big, fat round number. The problem is that the end number is much less important than what it can generate. The table below shows $1,000,000 and what it can generate at varying interest rate levels.
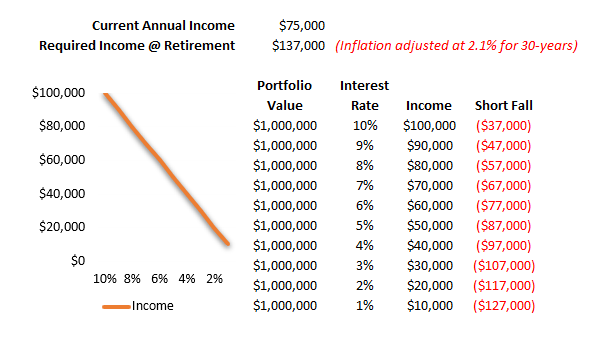
30-years ago, when prevailing rates were substantially higher, and living standards were considerably cheaper, a $1,000,000 nest egg was substantial enough to support retirement when combined with social security, pensions, etc.
Today, that is no longer the case.
Since most investors only have 20 to 30-years to reach their goals, if that period begins when valuations are elevated, the odds of success falls dramatically.
This is why “time” becomes such an important determinate of success.
In all of the analysis that is done by Wall Street, “life expectancy” is never factored into the equations used when presenting the bullish case for investing. Therefore, in order to estimate future inflation-adjusted total returns, we must adjust the formula to include “life expectancy.”
RTR =((1+(Ca + D)/ 1+I)-1)^(Si-Lfe)
Where:
- Ca = Capital Appreciation
- D = Dividends
- I = Inflation
- Si = Starting Investment Age
- Lfe = Life Expectancy
For consistency, we will assume the average starting investment age is 35. We will also assume the holding period for stocks is equal to the life expectancy less the starting age. The chart below shows the calculation of total life expectancy (based on the average of males and females) from 1900-present, the average starting age of 35, and the resulting years until death. I have also overlaid the rolling average of the 20-year total, real returns and valuations.

Importantly, notice the level of VALUATIONS when you start investing has everything to do with the achievement of higher rates of return over the investable life expectancy of an individual.
There is a massive difference between AVERAGE and ACTUAL returns on invested capital. The impact of losses, in any given year, destroys the annualized “compounding” effect of money.
As shown in the chart box below, I have taken a $1000 investment for each period and assumed a real, total return holding period until death. No withdrawals were ever made. (Note: the periods from 1983 forward are still running as the investable life expectancy span is 40-plus years.)
The gold sloping line is the “promise” of 6% annualized compound returns. The blue line is what actually happened with invested capital from 35 years of age until death, with the bar chart at the bottom of each period showing the surplus or shortfall of the goal of 6% annualized returns.
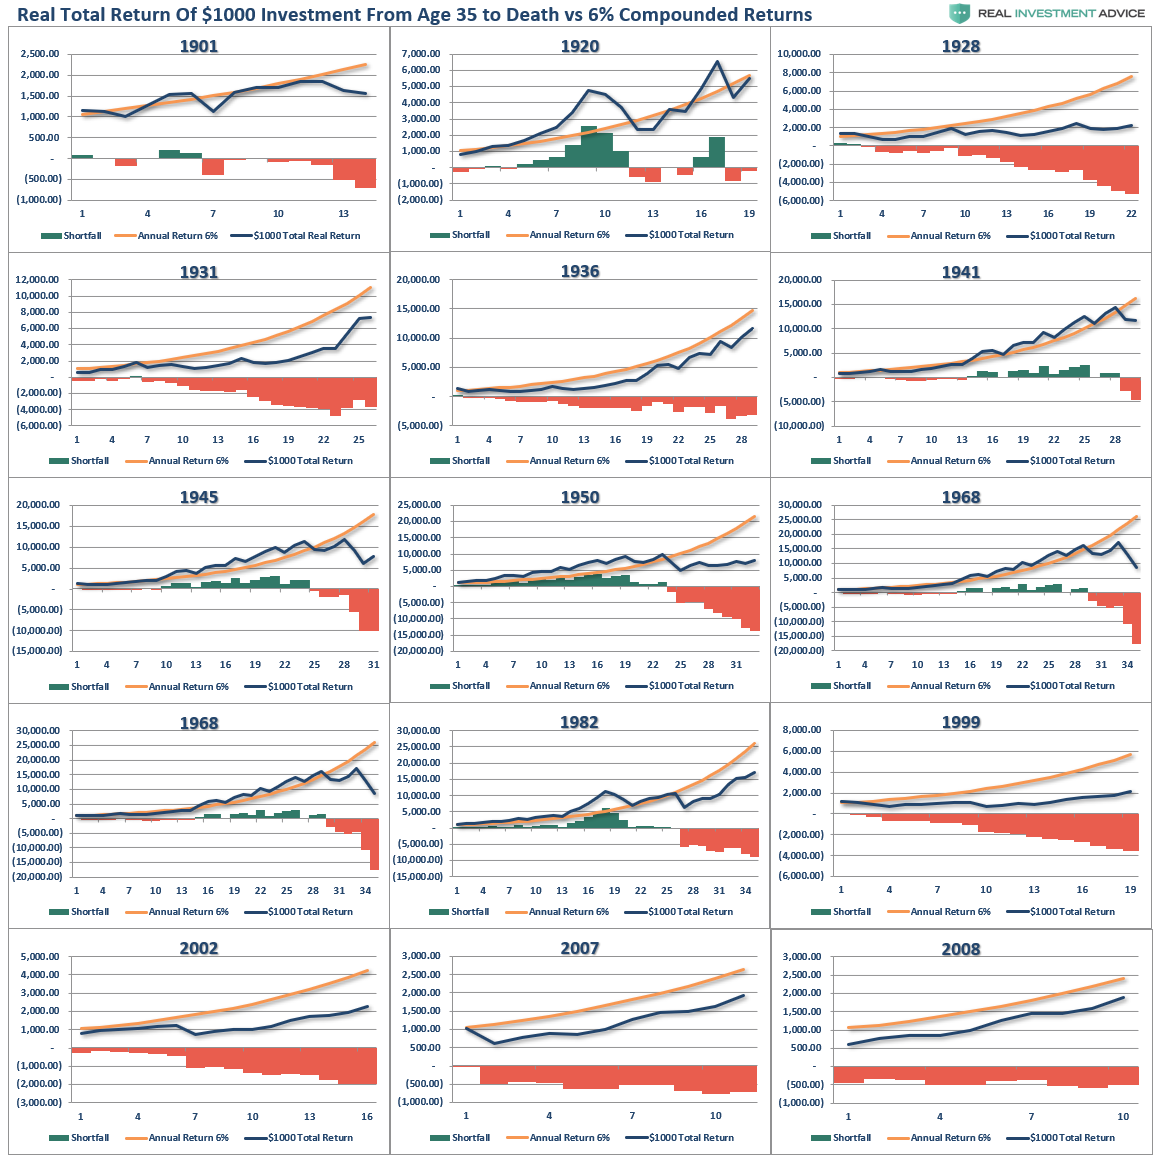
In every single case, at the point of death, the invested capital is short of the promised goal.
The difference between “close” to goal, and not, was the starting valuation level when investments were made.
This is why, as I discussed in “The Fatal Flaws In Your Retirement Plan,” that you must compensate for both starting period valuations and variability in returns when making future return assumptions. If you calculate your retirement plan using a 6% compounded growth rates (much less 8% or 10%) you WILL fall short of your goals.
The Next Bear Market Will Be The Last
After two major bear markets since the turn of the century, a vast majority of “baby boomers” are woefully unprepared for retirement. Dependency on social welfare is at record highs, individuals are working far longer into retirement than at any other point in history, and after a decade long bull market many investors have only just recently gotten back to where they were 10-years ago.
It is from this point, given valuations are once again pushing 30x earnings, that we review the expectations that individuals facing retirement should consider.
- Expectations for future returns and withdrawal rates should be downwardly adjusted due to current valuation levels.
- The potential for front-loaded returns going forward is unlikely.
- Your personal life expectancy plays a huge role in future outcomes.
- The impact of taxation must be considered.
- Future inflation expectations must be carefully considered.
- Drawdowns from portfolios during declining market environments accelerates the principal bleed. Plans should be made during up years to harbor capital for reduced portfolio withdrawals during adverse market conditions.
- The yield chase over the last 10-years, and low interest rate environment, has created an extremely risky environment for investors. Caution is advised.
- Expectations for compounded annual rates of returns should be dismissed in lieu of variable rates of return based on current valuation levels.
Importantly, chasing an arbitrary index that is 100% invested in the equity market requires you to take on far more risk that you most likely realize.
For the majority of individuals today facing, or in, retirement the two previous bear markets have left many further away from retirement than they ever imagined.
The next one will destroy those goals entirely.
Investing for retirement, should be done conservatively, and cautiously, with the goal of outpacing inflation, not the market, over time. Trying to beat some random, arbitrary index that has nothing in common with your financial goals, objectives, and most importantly, your life span, has tended to end badly for individuals.
You can do better.