Chart: This is starting to look like an intentional devaluation by Beijing to offset the impact of US tariffs; onshore & offshore yuan July 20, 2018 3:45 pm
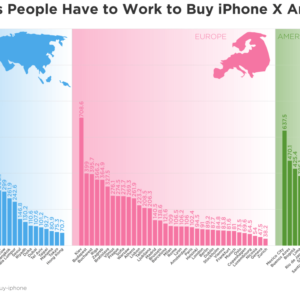
The iPhone X Index: This Chart Shows How Ridiculously Long You Have to Work to Get One July 19, 2018 11:09 amJuly 18, 2018 2:58 pm
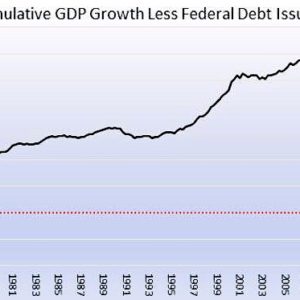
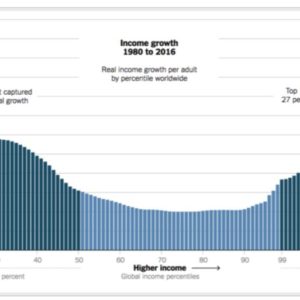
US ECONOMY BULLS: The most important chart you’ll ever see. July 19, 2018 11:09 amJuly 18, 2018 10:49 am
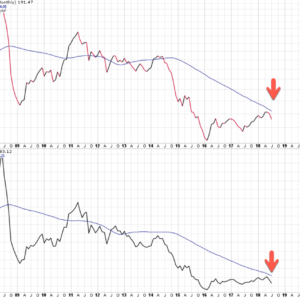
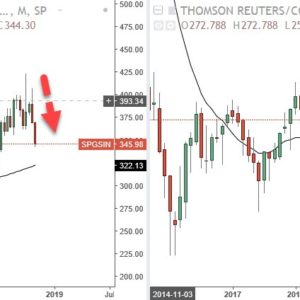
Industrial Metals & CRB Index slammed on a monthly chart — global slowdown fears? July 17, 2018 2:31 pm
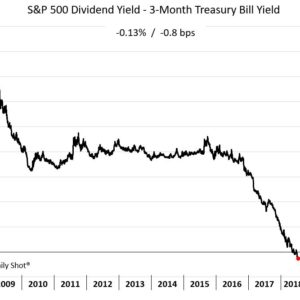
Chart: Cash is looking increasingly attractive relative to stocks; S&P 500 dividend yield less 3-month T-bill yield July 17, 2018 1:40 pm
Chart of the week: U.S. consumer debt grew the most in six months in May as total credit outstanding climbed $24.6 billion to $3.898 trillion July 16, 2018 5:13 pm
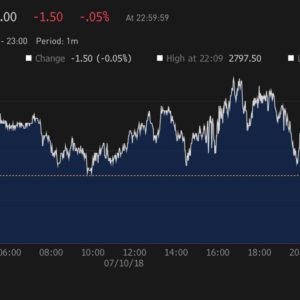
TradeWar chart! S&P 500 Index future reverses gains as #Trump is said to release a list of an additional $200 billion in Chinese products to be hit with #tariffs. Everyone who bought the dip in cash session was wiped out in minutes July 10, 2018 5:25 pm
If You’re A Millennial & Just Bought A Home, Take A Look At This Chart June 19, 2018 2:44 pmJune 18, 2018 2:31 pm