via Kimble Charting
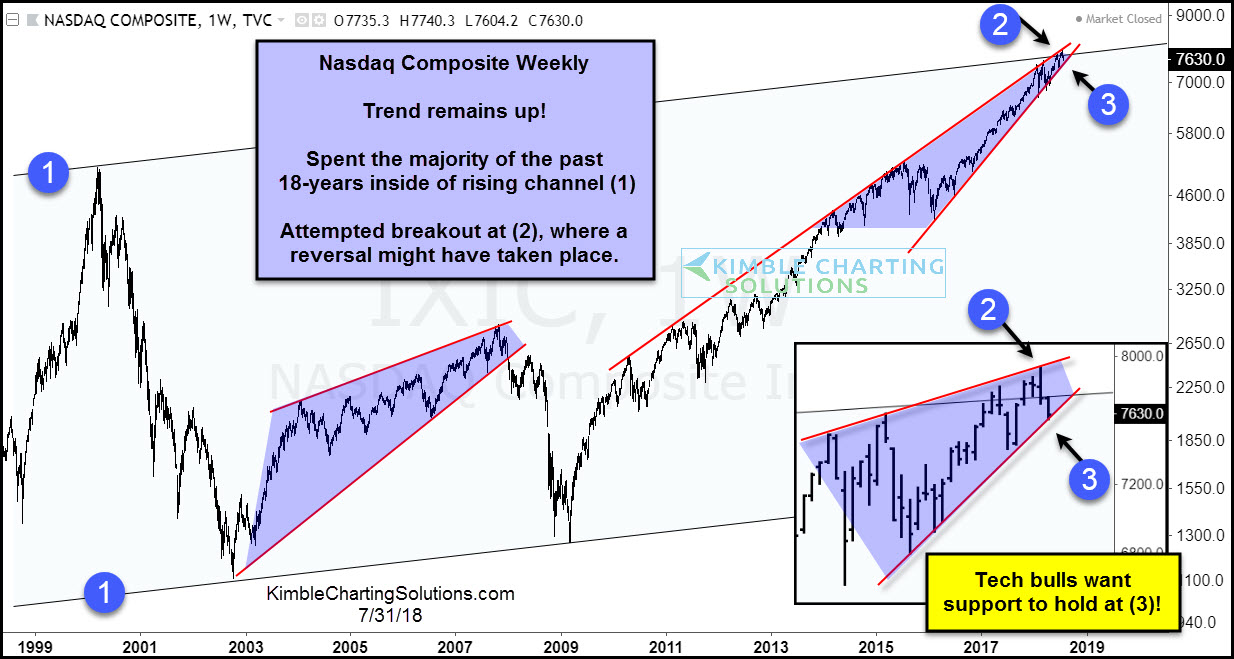
This chart looks at the Nasdaq Composite Index over the past 20-years. The index has spent the majority of the past 18-years inside of rising channel (1).
The trend is clearly up as the index is very near all-time highs and nothing of late has changed that trend!
The index did push above the top of this channel a couple of weeks ago, as it was working on a breakout. As it was attempting to break out, it might have created a reversal pattern at (2).
A test of 2-year rising support is taking place this week at (3). For the first time in months, the index is now below its 50-day moving average.
Tech bulls want to see support hold at (3). If it does not hold, don’t be surprised if further selling pressure takes place!
****
QQQ (monthly) tagging 1.618-extension
- China Just Made A Move That Could Literally Provoke A Major War With The United States
- Canada: Housing prices are collapsing and jobless increases. 1/6 homeowners in Canada own 4 or more properties.
- Bill Gates Developing Vaccine That Spreads ‘Like a Virus’ To Vaccinate People Without Consent
- It is a totalitarian system: The FBI is raiding Mar-a-Lago and trying to criminalize opposition to the regime. NEVER in the history of the United States has the FBI ever carried out such a raid.
- Asian television: ‘More people are dying from the Vaccine than from Covid’…
- Brazilian Police Officer reminds unruly citizen this ain’t America
- How “Big Woke” Destroyed the Film Industry
- Insurance CEO, Todd Callender says the real pandemic is NOW.
- An Attempt To Summarize The Current State Of Our Country In Just 12 Tweets
- Next leg lower will wipe out what’s left of the remaining hopefools
Views: 0