This technical setup was for short $SPX in context approaching markets with a sell strategy into September options expiration consistent with the Sell Zone indicated in June for $SPX 3,000 -3,050 and the Bear Case suggestive of downside risk in markets. This setup was briefly discussed in last weekend’s update video. Below is the full sequence.
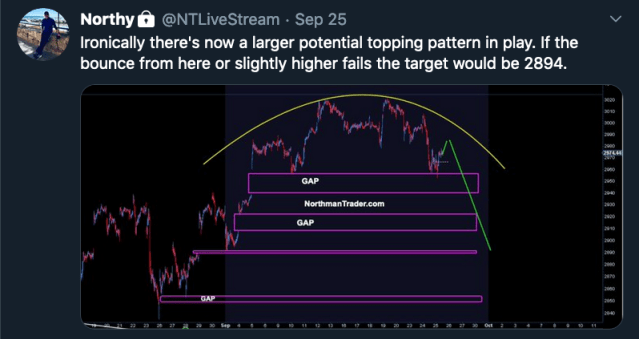
As price/charts evolved a topping pattern emerged suggestive of a 2894 measured price target. The $SPX and $ES charts highlighted below show how topping patterns require patience in seeing price targets realized as price can chop inside the pattern range before a breakdown is confirmed.
The chart sequence also show price levels at which this pattern would be invalidated as no pattern is confirmed until it is triggered. This creates uncertainty that needs to be accounted for in the risk assessment. Once pice target is reached a particular setup is closed.


We then noted a smaller bear flag emerging that suggested further downside pressure come:


While the smaller bear resulted in a tag of the upper one gap a renewed bounce occurred setting up for a back test of the broken bear flag:


Then the wedge on $ES broke and the backtest of the bear flag rejected:


Nut now that support was confirmed broken the original target was reached quickly:

