by Lance Roberts

“Technically Speaking” is a regular Tuesday commentary updating current market trends and highlighting shorter-term investment strategies, risks, and potential opportunities. Please send any comments or questions directly to me viaEmail, Facebook or Twitter.
In last week’s post, I did a complete sector and major market review. Not much has changed in the past week given the very quiet activity that has persisted. This lack of volatility, while not unprecedented, is extremely long in duration as noted in past weekend’s newsletter, “An Unexpected Outcome:”
“Speaking of low volatility, the market has now gone 108-trading days without a drop of 1% for both the Dow and the S&P 500. This is the longest stretch since September of 1993 for the Dow and December of 1995 for the S&P 500.”
The issue becomes, of course, which way the market breaks when volatility returns to the market. Over the course of the last three years, in particular, those breaks have been to the downside as shown below.

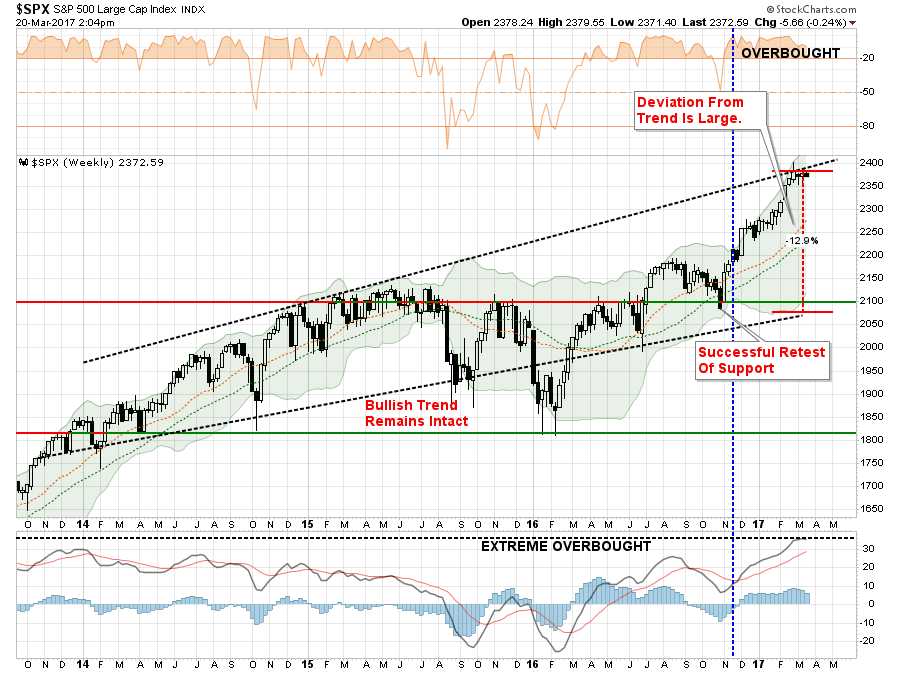
Given the particularly extreme overbought condition that currently exists, the strongest odds suggest the next pickup in volatility will be in the form of a corrective action to reverse some of that condition. As I detailed on Saturday:
“As noted in the chart below, the market is very close to a short-term ‘sell signal,’ lower part of the chart, from a very high level. Sell signals instigated from high levels tend to lead to more substantive corrective actions over the short-term. I have denoted the potential Fibonacci retracement levels which suggest a pullback levels of 2267, 2230, and 2193. To put this into ‘percent terms,’ such corrections would equate to a decline of -4.7%, -6.2% or -7.8% from Friday’s close.”
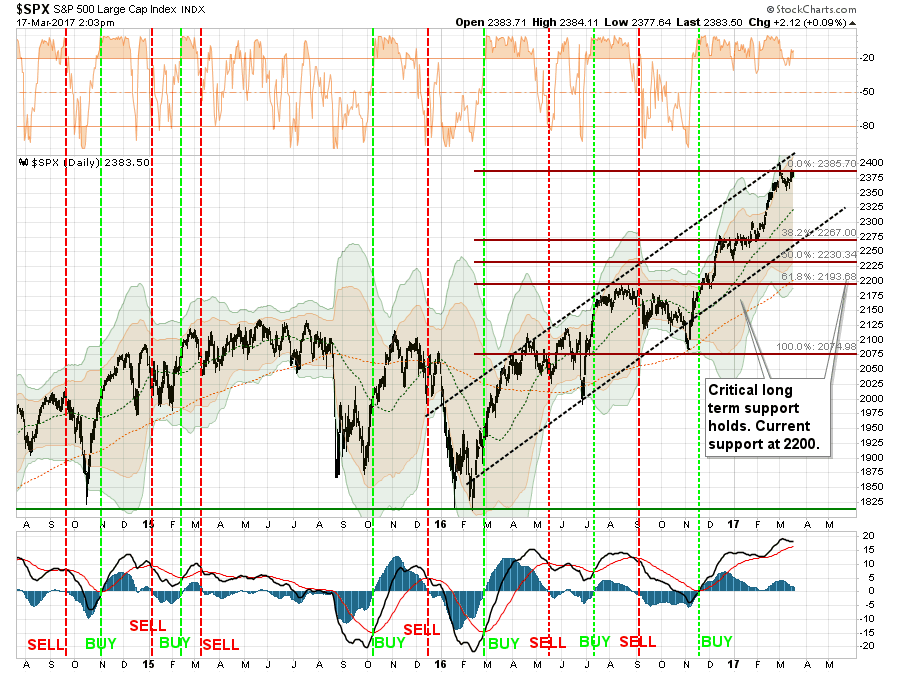
“To garner a 10% decline, stocks would currently have to fall 237.8 points on the S&P 500 to 2140.20. Given there is little technical support at that level, the market would likely seek the next most viable support levels at the pre-election lows of 2075 or a decline of -12.7%.
Such a decline, of course, would not only wipe out the entirety of the ‘Trump Bump,’ but would also ‘feel’ much worse than it actually is given the exceedingly long period of an extremely low volatility environment.”
Of course, it could even be worse as noted on CNBC last week:
“Are you ready for a 2,000 point drop in the Dow? That’s what a ‘normal’ correction would look like now. Normal corrections look kind of scary when markets are at these highs.
The Dow hit a new high on March 1 at 21,115. That means a 10 percent drop — what would be considered a ‘correction’ — would be a decline of 2,111 points. Sounds pretty steep, no?
Here’s an even bigger drop: 3,000 points. Dan Wiener, who runs the Independent Adviser for Vanguard Investors and runs money as president of Adviser Investments, pointed out to clients that over the past 30 years the stock market has declined an average of 14.3 percent from high to low on an intra-year basis.
That translates into a 3,019-point decline from the Dow’s March 1 top.”
As I noted previously in “The World’s Most Deceptive Chart” it is the “math” that is the problem. A 10% decline seems relatively minor. By comparison, a 2000-point decline is “psychologically” painful and leads investors to make emotionally driven investment decisions which typically have bad outcomes.
“Fuhgettaboutit”
These short-term declines are why investors are told to just “buy and hold,” and just “ride the markets out” because you can’t effectively “time” these events.
Usually, these comments are attached to the fictional idea that investors actually bought the lows. Like this one:
“Finally, here’s an illustration of the power of staying in the market, not trying to time investing, and the beauty of compounding interest. March 9 was the eighth anniversary of the bottom of the market. It was widely noted that the S&P 500 was up over almost 250 percent since then.
Here’s an even more interesting tidbit: It’s up about 310 percent when dividends are accounted for.
That’s the power of compounded interest! That’s about a 19 percent annual compounded gain every year for eight years.
Think about that. Your money would be up an average of almost 20 percent a year when dividends are included and the money is reinvested over the last eight years. That is a remarkable run.”
It’s true…that is quite a remarkable run. In f
act, it is one of the longest-running bull markets in history.
They just never seem to remind you of what has happened next?
More importantly, following these regularly occurring “mean reverting” events, investors were not scrambling to buy the lows. Quite to the contrary, retail investors were often finally capitulating at the lows and liquidating their portfolios with the promise of “never buying stocks again.”
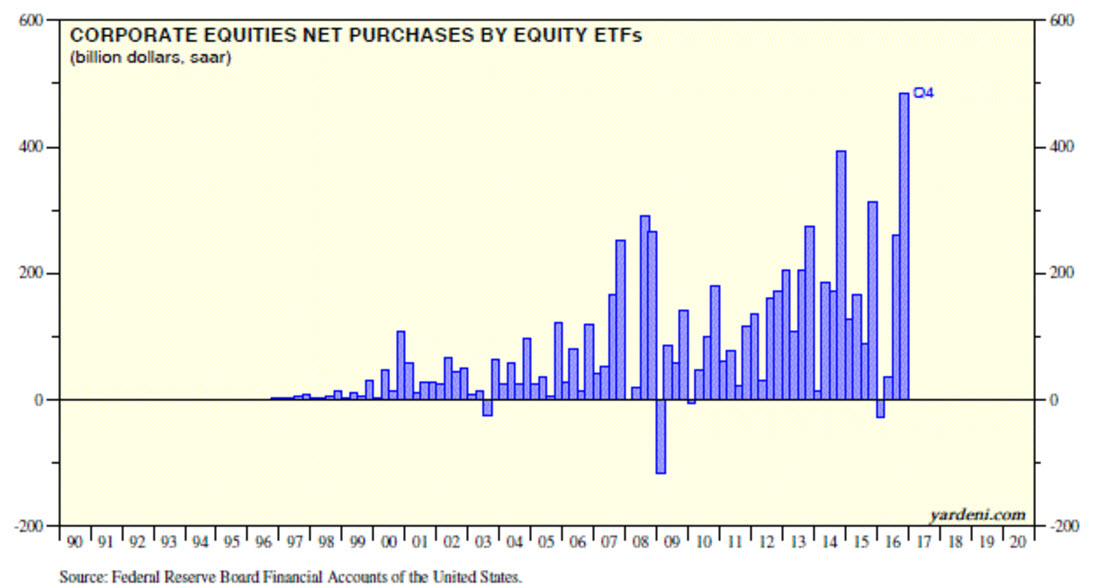
Generally, they hold good to that promise until the markets rise to the next “bull market” peak and the pressure of “missing out” becomes too great. As shown in Ed Yardeni’s chart below, despite the commentary about how markets have compounded returns in recent years, a lot of investors were VERY late getting back into the investment game.
As I stated, the bull market remains intact currently and should not be dismissed lightly. Bull markets are extremely buoyant because of the underlying “psychology” that promotes it.
As John M. Keynes once quipped: “Markets can remain irrational longer than you can remain solvent.”
However, there are some warning signs worth watching.
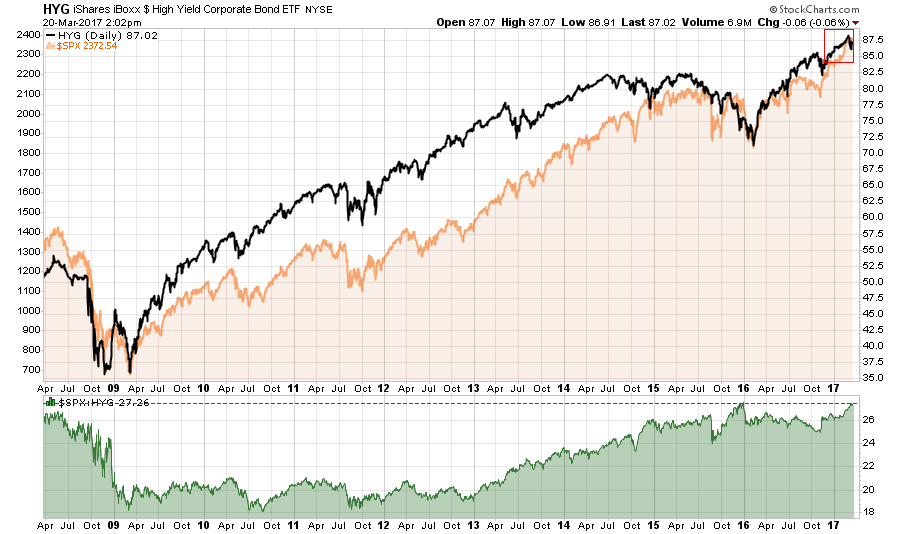
High yield bonds have started to exhibit weakness at a time when the stock/high yield bond ratio is at the highest level since the financial crisis. While, in and of itself, a high ratio is not indicative of a “crash,” it is the “fuel” for a “fire” if one occurs.
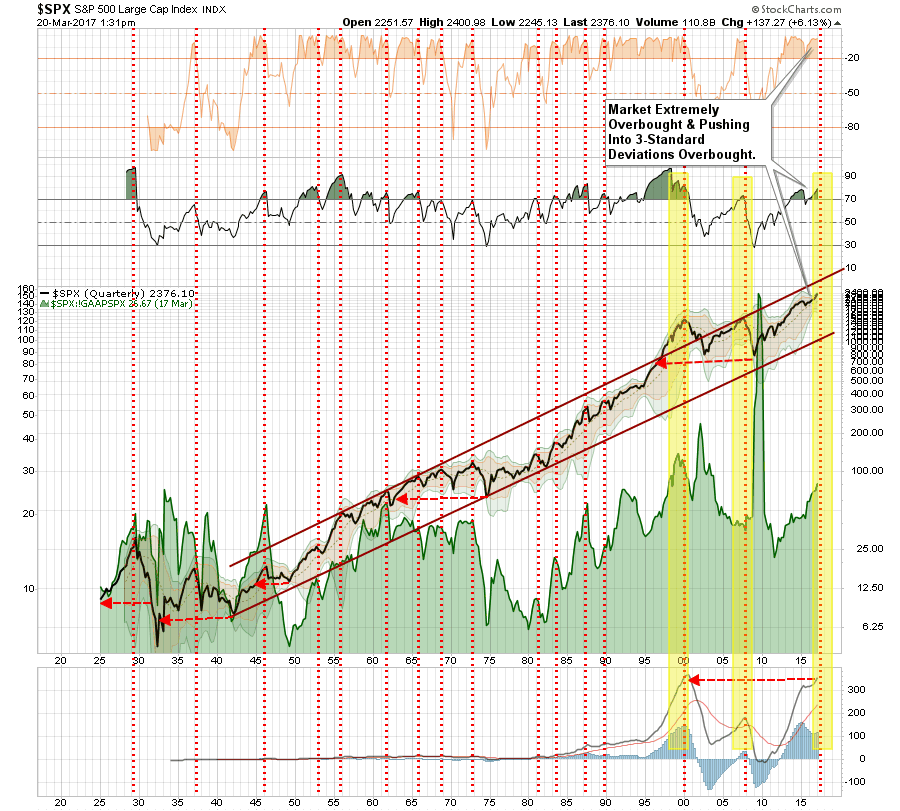
As I have discussed before, the current deviation from the underlying bullish trend has historically been unsustainable over a longer-term period. Like “stretching a rubber band,” the extension must be relaxed either through consolidation or correction before the next advance can occur.
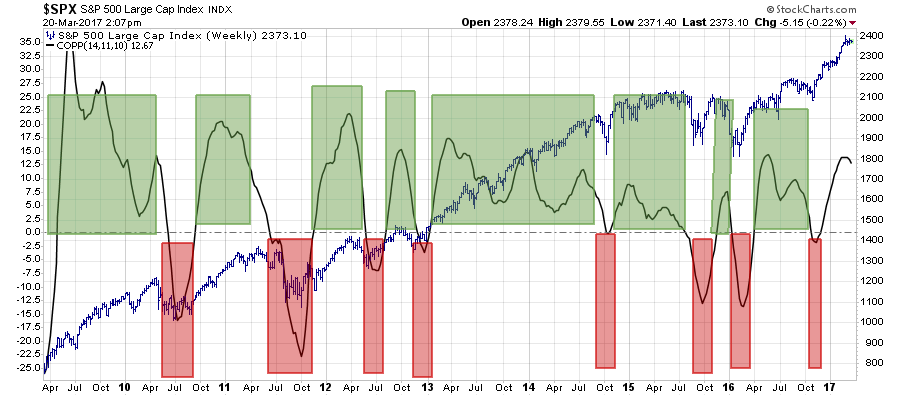
The Coppock Curve has also recently peaked and has begun to turn lower. This is typical during short-term corrections.
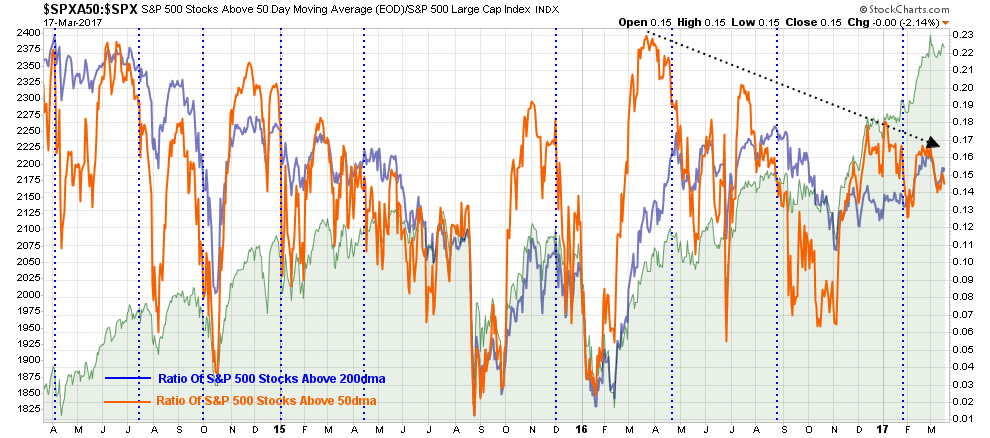
One of the more concerning trends continues to be the deterioration in breadth as the number of stocks leading the market continues to decline despite indices sitting near all-time highs.
Jason Goepfert via Sentiment Trader recently noted that when the CBOE SKEW index climbs this far above the VIX, a downturn has tended to follow in the next 30 to 60 days.
“Historically, when we have seen an extreme in the relationship between the SKEW and VIX, the S&P moves in the opposite direction over the next 1-2 months.”
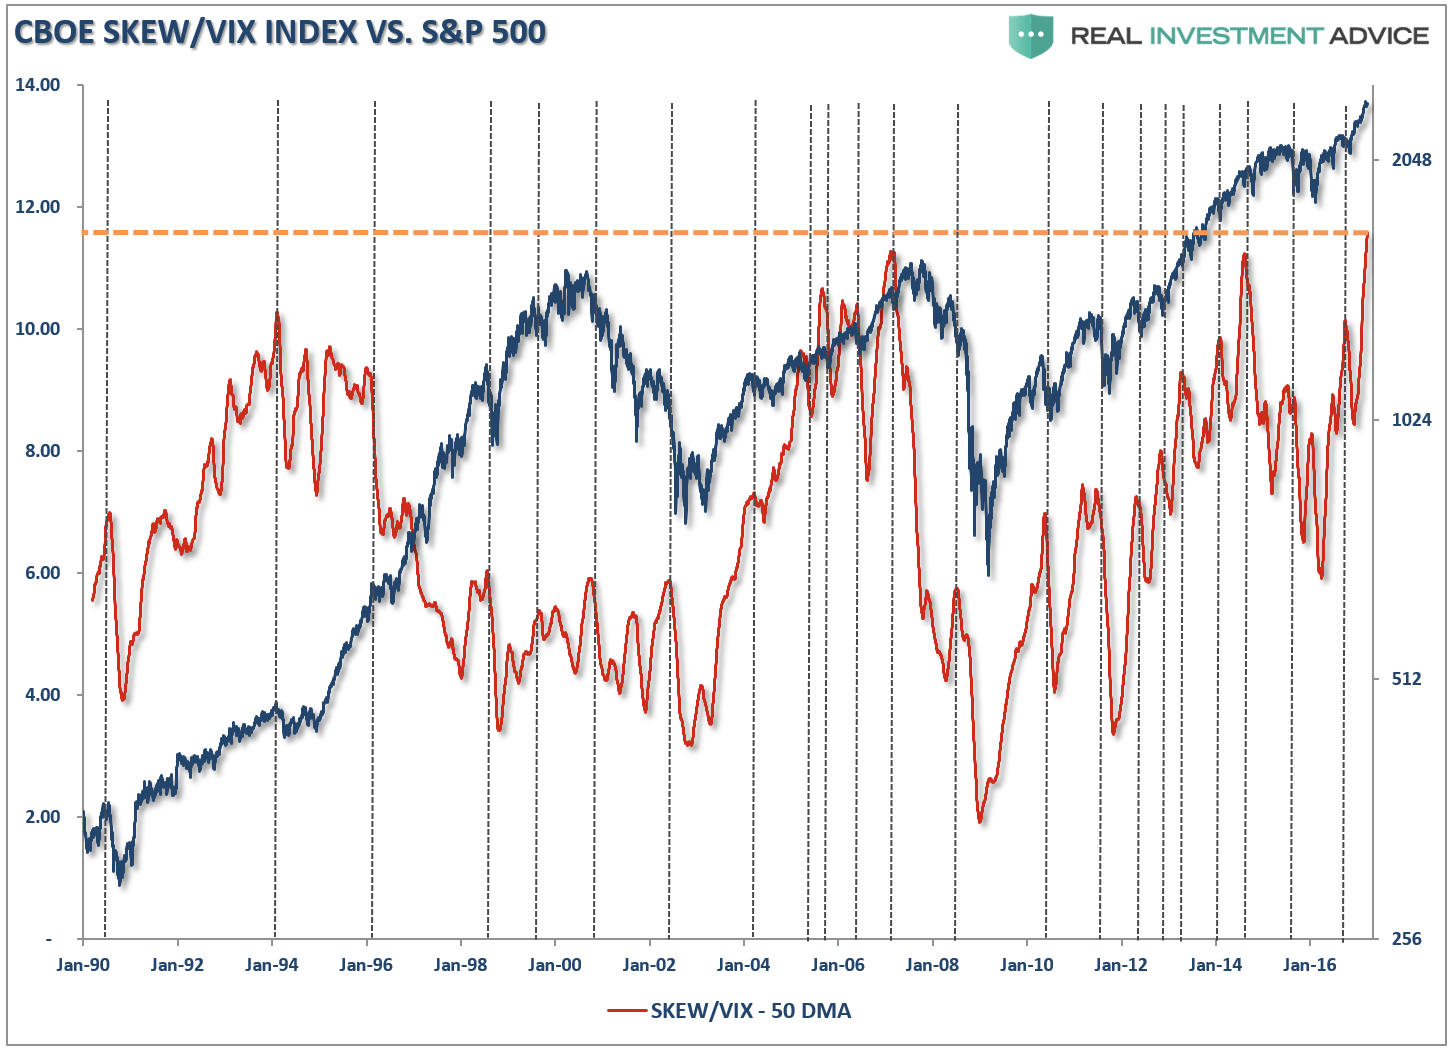
With the 50-dma of the SKEW/VIX ratio at the highest level of record, this is probably an indicator best not ignored.
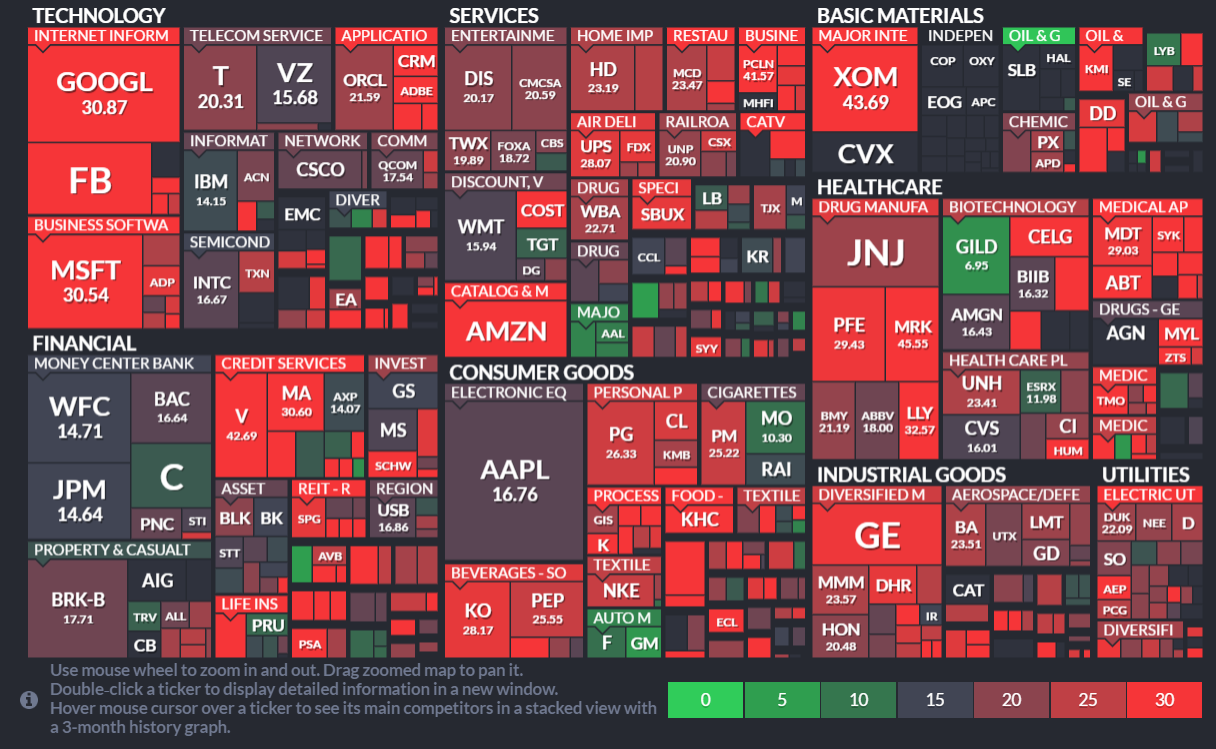
Along with the ongoing weakness in the technical backdrop, the fundamental backdrop continues to weaken as shown in the P/E heat map below of the S&P 500.
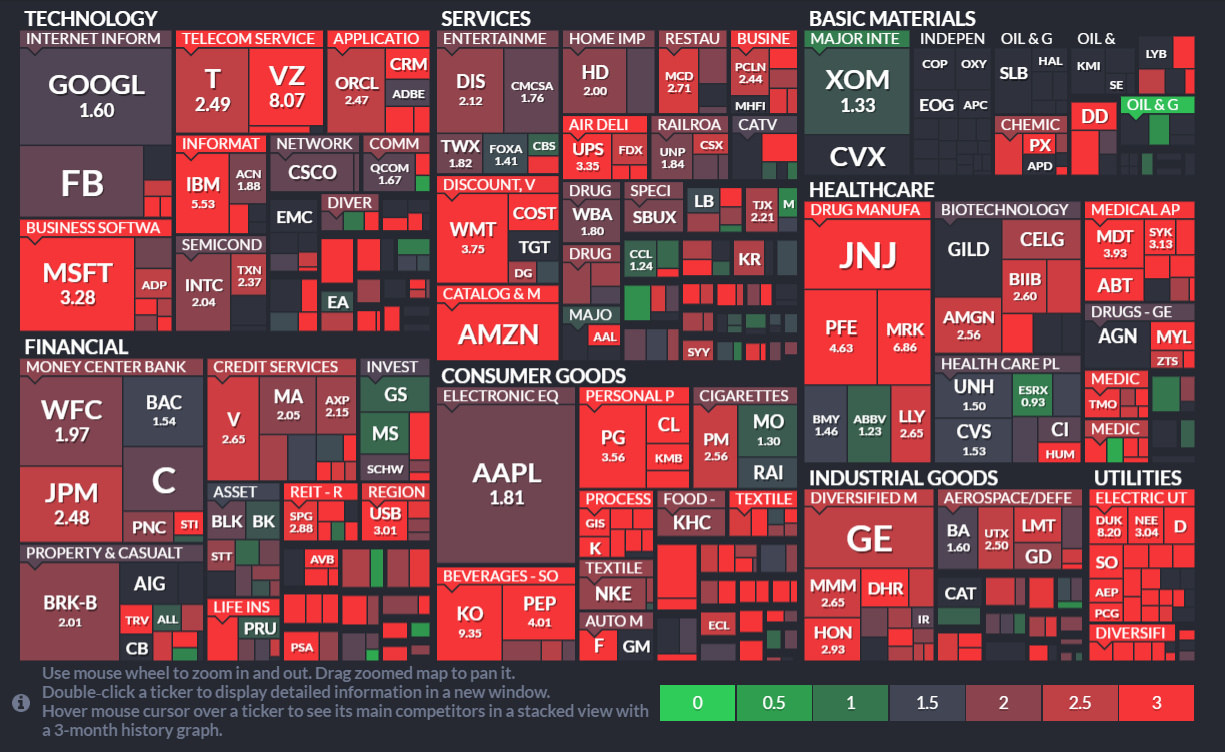
The same goes for the PEG heat map as well.
The point here is simple.
Portfolios should be allocated to equities currently because the bull market trend is still firmly intact.
However, while I agree that you can not consistently and effectively “time” the market, which is being either “all in” or “all out,” I am suggesting that being prudent about the level of risk you are taking within your portfolio allocation can be curtailed.
So, just invest and “fuhgettaboutit?”
Probably not the best idea. That approach has tended to yield very poor outcomes when the present conditions have existed previously.
Importantly, in each period, it was always believed “this time is different.” Unfortunately, it never was.