by UPFINA
There is more to stocks than which factor they are in. It would be silly to avoid a stock just because it doesn’t fit your favorite factor style. However, overall positioning decisions should be reviewed through this lens. If you decide to go overweight energy and banks, you are implicitly going long the value factor whether you like it or not. You can’t trade how you want the market to be. You must trade the market that you have at hand. This sounds short term oriented, but when the moves are record breaking, it is time to adapt. The oil services index is up over 40% in November. Those are years’ worth of gains in a couple weeks. Surely, you don’t want to ignore the factor trade now.
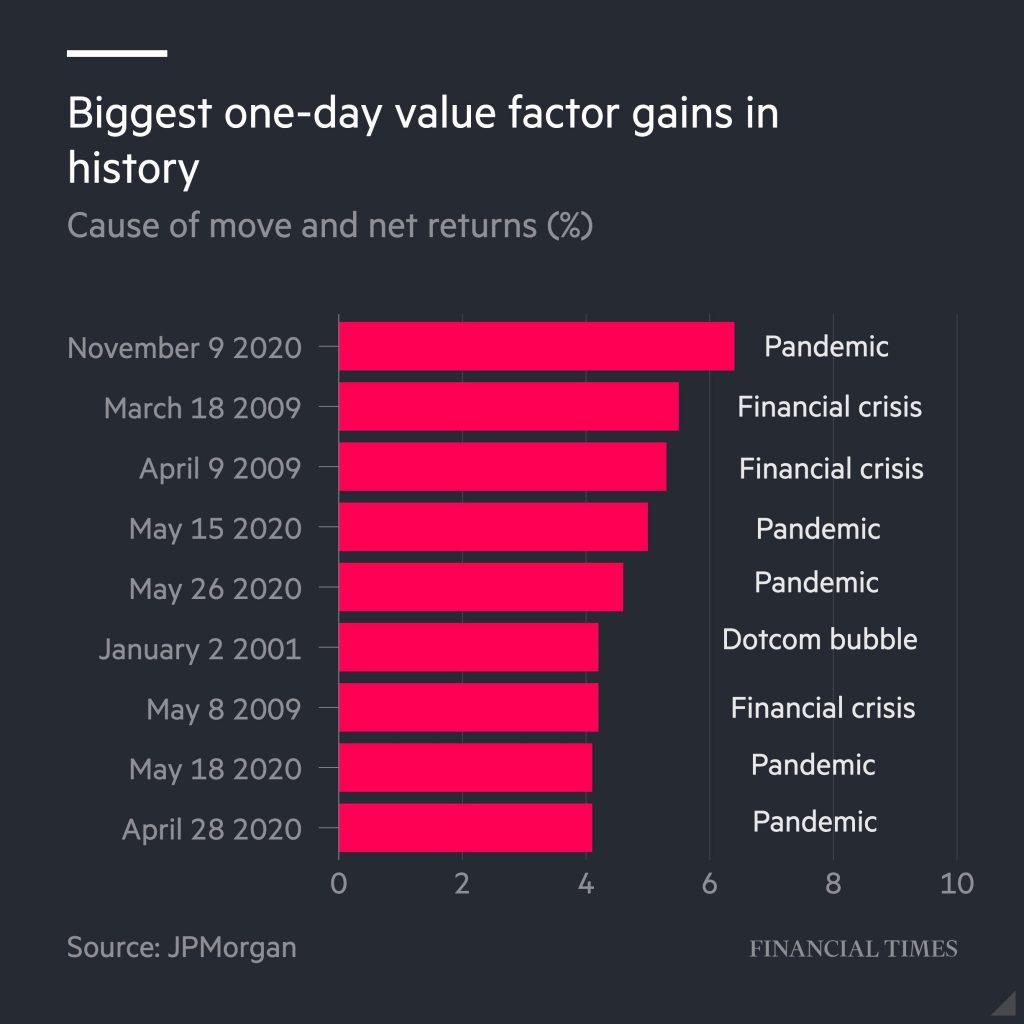
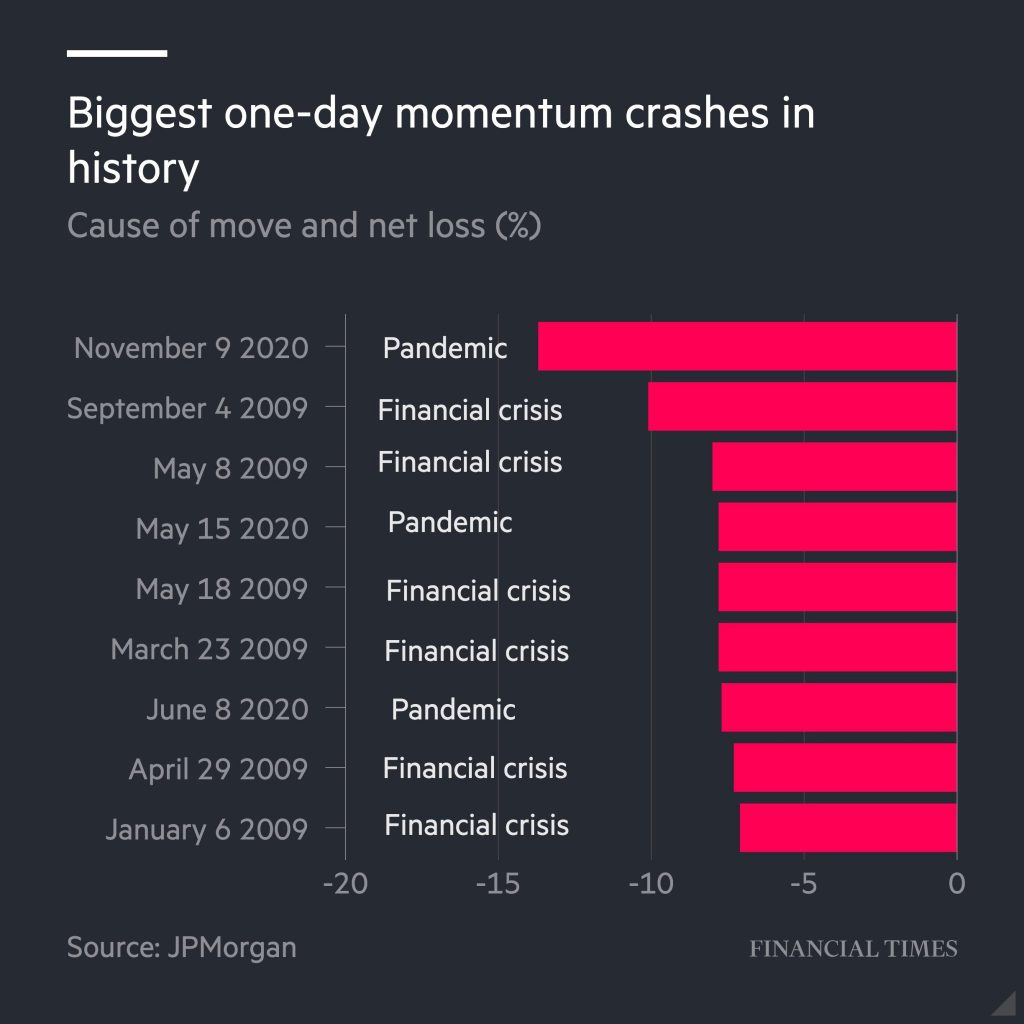
Ignoring the value versus growth debate will only hurt your short term performance even if you think it’s incomplete. The market reacts first and asks questions later. You can make money on the initial reaction and then pick among the rubble later on. As you can see from the chart above, the value factor gained over 6% on November 9th which was its best day ever. Furthermore, most of the top daily gains have occurred this year. Momentum’s nearly 15% decline was its largest ever. Furthermore, value outperformed again on November 16th when Moderna’s vaccine was announced.
Even though it was widely known that Moderna’s vaccine would be effective, due to the time it took to get the results, the small cap value index still rose 3.4% on Monday. The index is up 19.4% since October 28th. The regional bank index is up 24.5% since October 28th. According to one bank, value has a 17 PE ratio and growth has a 38 PE ratio which is a larger differential than the peak of the tech bubble (growth peaked at a PE of 47). The fact that the 3rd wave of COVID-19 cases is doing nothing to stop the reopening trade shows how powerful the cyclical rally is. Energy had a record low weighting and well below -2 z-score positioning among investors before this move. When everyone leans one way, a reversal can be like a tidal wave.
The Catastrophes Throughout History
With the market at a record high and the Russell 2000 on its best 11 day run since 2011, now is the time to talk about catastrophic risk. Yes, it sounds crazy, but stocks don’t always go up if you pick individual tickers. The indexes’ rallies make picking stocks look easy, but they swap out the underperformers, leading to survivorship bias. Companies have lifecycles. They rise and fall. They don’t grow forever.
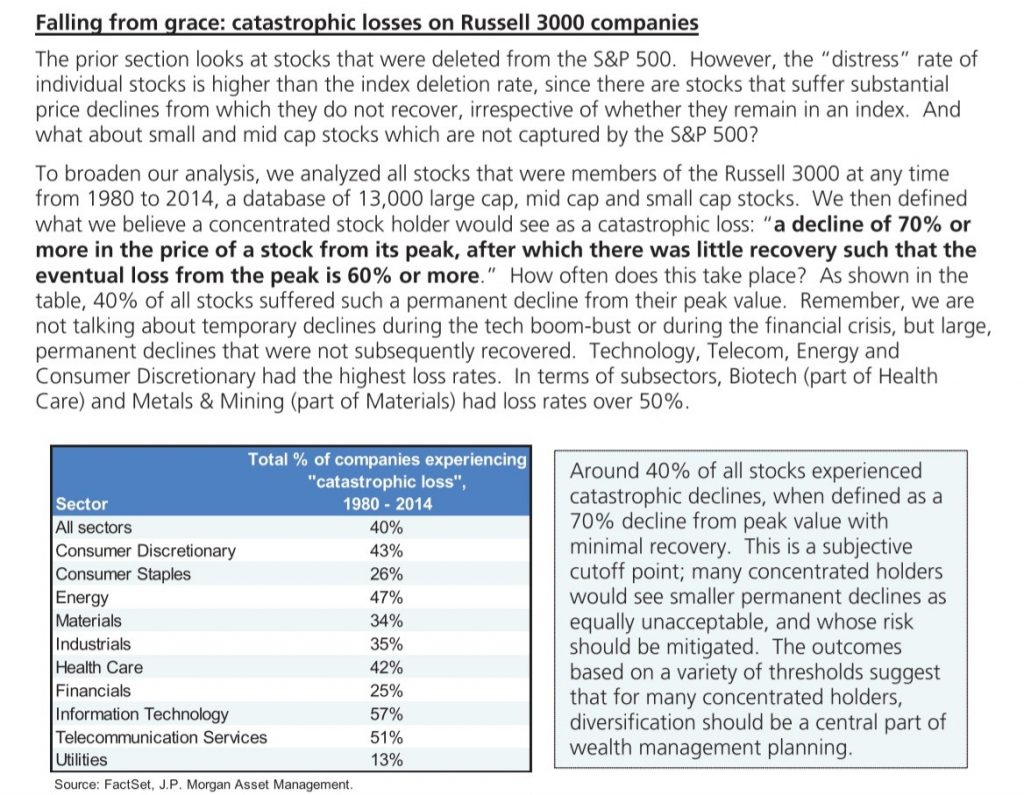
A catastrophic loss is a decline of 70% or more with minimal recovery. 40% of all stocks experienced this from 1980 to 2014. In other words, at random, you have a 40% chance of being very wrong. Your odds change depending on the sector. It’s actually rare for utilities and consumer staples to experience this as they have odds of 13% and 26%. It’s easy to see why. These industries have much less disruptive innovation.
An innovation in snacking is changing packaging. On the other hand, a tech company can go obsolete instantly after a new invention is made. That’s why tech has a 57% chance of catastrophic failure. Euphoric tech investors in 2020 are completely ignoring this 34 years of compiled data. If the data was taken in the past 6 years, tech would have done better and energy would have done worse. This is a feature, not a bug of this data set.
Success Versus Failure By Sector
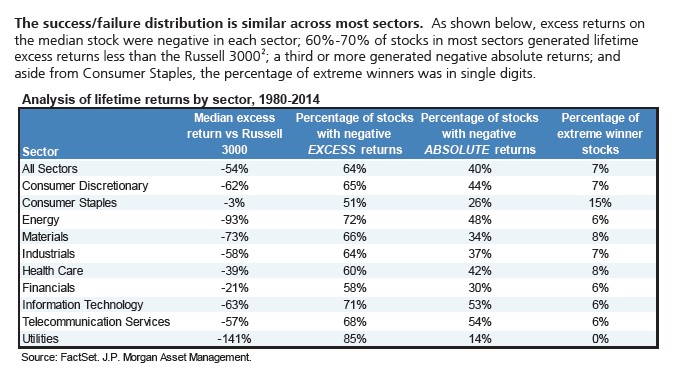
The table below doesn’t portray utilities in as good of a light.
As you can see, the median excess return of the utilities sector is -141% and 85% had negative excess returns versus the Russell 3000. However, only 14% had negative absolute returns. Then again, none were extreme winners. This is a low risk low reward sector. Consumer staples is the best sector. This explains why you often see low growth combined with high PE ratios. You must pay up to buy a company with great brands because that’s a tough moat to break. Think of your favorite candy. Will your favorite candy be the same in 5 years? Is it the same as it was 5 years ago? Your opinions/tastes probably haven’t changed and won’t change.
As you can see, consumer staples had -3% median excess returns versus the Russell 3000. That’s the best. Only 52% had negative excess returns which is also the best. It has low risk and high reward as 15% of these stocks were extreme winners. As you can see, tech, financials, and energy all have 6% extreme stock winners. So much for tech being the place for big winners. This year has been a rare one. It has only been matched by the late 1990s tech bubble.
Details On Student Loan Debt
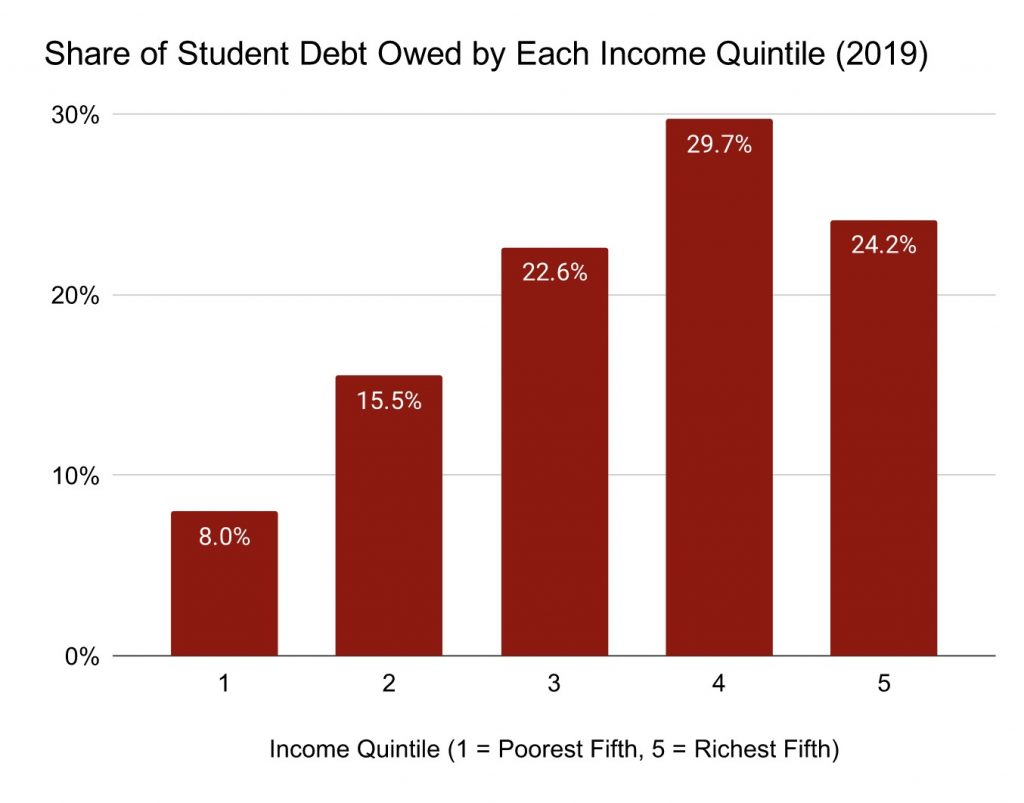
We have new data on student loans that suggests it is less of a crisis than initially was let on. As you can see from the chart below, 24.2% of student debt is held by people in the top 20% of incomes which means they should be able to easily pay it back. It makes sense because people with degrees earn more money. This shows the student debt issue isn’t as catastrophic for the economy as the headlines suggest. That’s not to say that there aren’t severe structural issues with student loans, however.
The net worth stats aren’t the same as this, but that’s because younger people carry student debt. If someone has a high net worth later in life, they will have paid off their loans. Net worth is largely a function of age. 8.2% of student loans debt is owed by those in the top 20% in terms of net worth excluding student loans. On the other hand, 17% of the debt is held by the by the bottom 20%. 31.5% is held by those between the 20th and 40th percentile.
Conclusion
Don’t ignore factor investing because it has been driving huge moves this year. It should impact your positioning. Utilities are low risk and low reward. Historically consumer staples are low risk and high reward which is obviously the sweet spot. Energy, financials, and tech all have the same odds of having extreme winners which isn’t what you’d expect based on this year’s returns by sector. The student loan crisis might not be as bad as we thought.
