by Dana Lyons
The number of New Lows on the NYSE has expanded substantially, despite the fact that major averages just recently traded at 52-week highs; is that a sign of washed-out conditions or a deteriorating foundation?
Readers are likely aware that market internals, or breadth, play a heavy role in our quantified analysis of the attractiveness of the overall market landscape. Generally, it is in an effort to determine which direction most stocks are headed – and, thus, how we want our portfolio oriented. At times, though, we look for conditions to get so extreme in one direction that they become extremely prone to reverting to the other direction. For example, during the depth of a selloff, breadth can eventually become so bad that it can’t get any worse. Such conditions, i.e., “washouts”, can help investors identify likely bottoming junctures. That is the idea behind one of today’s Charts Of The Day.
Yesterday, the number of New 52-Week Lows on the NYSE equated to over 9% of all issues on the exchange. That is a very large number – particularly given the fact that the S&P 500 traded at a 52-week high just 7 days prior. In fact, it was just the 9th such unique occurrence in 50 years.
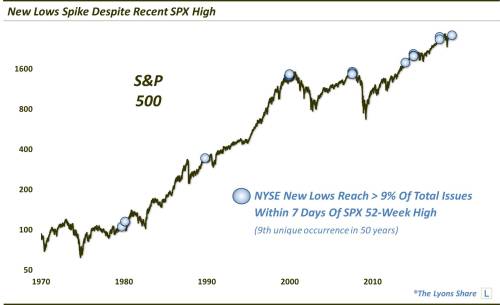
It also got us wondering whether it was indicative of a washed-out condition and a likely bottom – or merely a deteriorating backdrop in the market. We’ll let you be the judge.