Wolf Richter wolfstreet.com, http://www.amazon.com/author/wolfrichter
Seattle house prices drop 4.4% in four months, biggest drop since Housing Bust 1; Prices deflate in San Francisco Bay Area, San Diego, Denver, and Portland.
Some of the markets in this select group of the most spending housing bubbles in America have turned the corner, according to the S&P CoreLogic Case-Shiller Home Price Index, released this morning for October, confirming other more immediate data. This includes the Seattle metro, the five-county San Francisco Bay Area, the San Diego metro, the Denver metro, and the Portland metro. In these metros, house prices have skidded the fastest, and in some cases for the first time, since the Housing Bust. In other markets, house prices have been flat for months. And in a few markets on this list, prices rose. More on those markets in a moment.
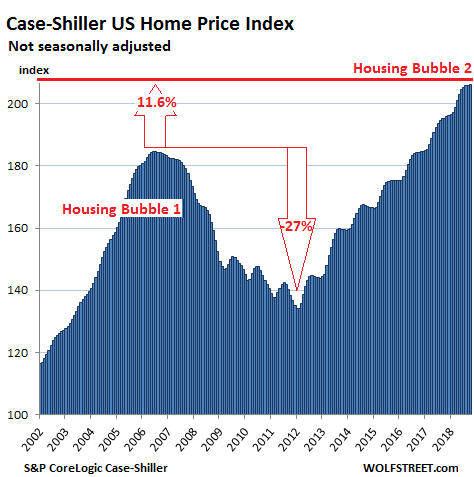
On a national basis, these dynamics get washed out. Single-family house prices in the US, according to the S&P CoreLogic Case-Shiller National Home Price Index, ticked up a smidgen on a month-to-month basis in October, and rose 5.5% compared to a year ago (not seasonally-adjusted). This year-over-year growth rate has been slowing from the 6%-plus range that reigned from September last year to July this year. The index is now 11.6% above the July 2006 peak of “Housing Bubble 1” (the first housing bubble in this millennium), which came to be called “bubble” and “unsustainable” only after it had begun to implode during “Housing Bust 1”:
The index is a measure of inflation — not of consumer price inflation but of house-price inflation, where the same house requires more dollars over the years to be purchased. In other words, the index shows to what extent the dollar is losing purchasing power with regards to buying the same house over time.
The Case-Shiller Home Price Index is a rolling three-month average; today’s release is for August, September, and October data. Based on “sales pairs,” it compares the sales price of a house in the current month to the prior transaction of the same house years earlier. The index incorporates other factors and formulas to arrive at each data point.
The index tracks single-family houses. In some large markets, Case-Shiller provides a separate index for condos. Unlike median-price indices, the Case-Shiller index does not indicate dollar-price levels. It was set at 100 for January 2000; hence, an index value of over 200 means prices as tracked by the index have more than doubled since the year 2000. This is the case for the National Home Price Index (above) and for every metro tracked on this list of the most splendid housing bubbles in America, except Dallas and Atlanta.
Seattle:
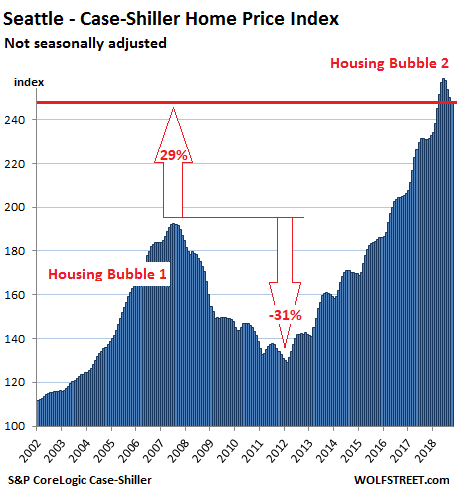
House prices in the Seattle metro dropped 1.1% in October from prior month, according to the Case-Shiller Home Price Index. The index has now dropped 4.4% in four months, the biggest four-month drop since Housing Bust 1 (December 2011). The historic spike that had peaked in June is now getting unwound at a rapid pace. If this pace continues for a 12-month period, the annual decline would be around 13%. The index is now at the lowest level since March.
Over the past 12 months, given the phenomenal spike into June, the index is still up 7.3% year-over-year. The index is up 29% from the peak of Seattle’s Housing Bubble 1 (July 2007), but that is down from the 35% increase in the July reading:
San Francisco Bay Area:
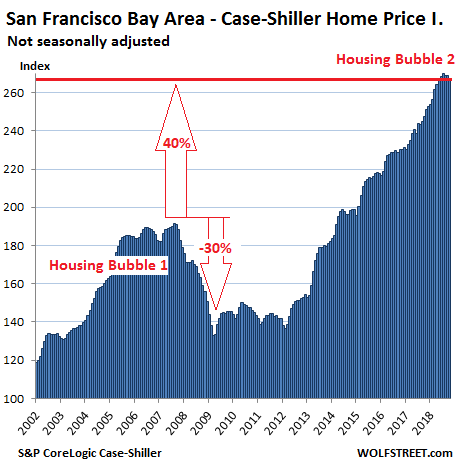
The Case-Shiller index for “San Francisco” includes five counties: San Francisco, the northern part of Silicon Valley (San Mateo County), part of the East Bay (Alameda and Contra Costa), and part of the North Bay (Marin). In October, the index for single-family houses fell 0.7% from September, to the lowest level since May. Over the past three months, the index is down 1.0%, the biggest three-month drop since March 2012.
The index was still up 7.9% from a year ago, after the surge in prices earlier this year, and remains nearly 40% above the peak of Housing Bubble 1:
Also in the five-county San Francisco Bay Area, the Case-Shiller index for condo prices edged down in October to the lowest level since April, and is down nearly 1% from the peak in June.
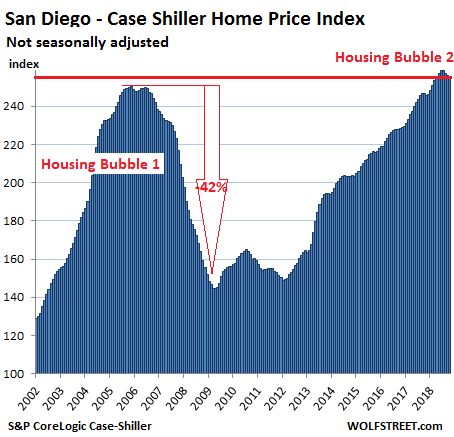
San Diego:
House prices in the San Diego metro edged down again in October and are now down 1.1% from their peak in June, the biggest four-month drop since Housing Bust 1 (March 2012). The Case-Shiller Index for the metro is now at the lowest level since April:
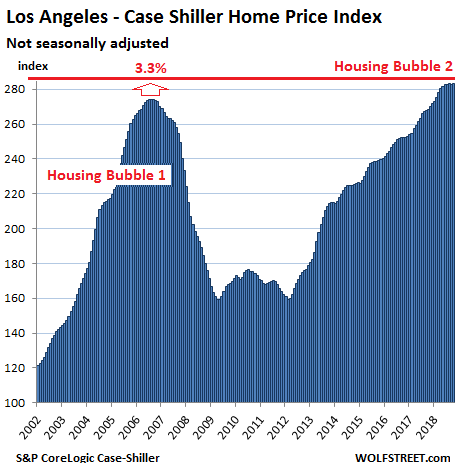
Los Angeles:
House prices in Los Angeles, after relentless increases through the spring, were flat in October for the fifth month in a row, when compared to the prior month, and were about at the same level as in June. The index is still up 5.5% from a year earlier and exceeds the crazy peak of Housing Bubble 1 by 3.3%:
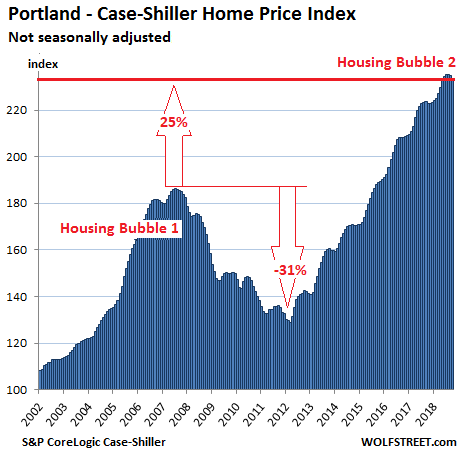
Portland:
The Case-Shiller index for the Portland metro in October dropped for the third month in a row, booking the biggest three-month drop since January 2013. The year-over-year gain has been whittled down to 4.9%. The index is now at the lowest level since April:
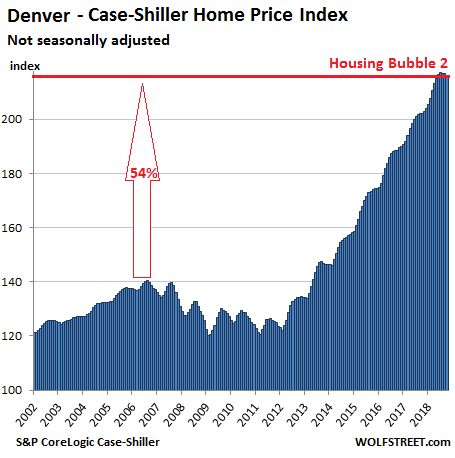
Denver:
Prices in the Denver metro fell in October for the third month in a row, compared to the prior month, after a perfect run of 33 monthly increases in a row. The index is now at the lowest level since May. The three-month drop was the first three-month drop since January 2014, and the largest since December 2013. The index is up 6.9% from a year ago:
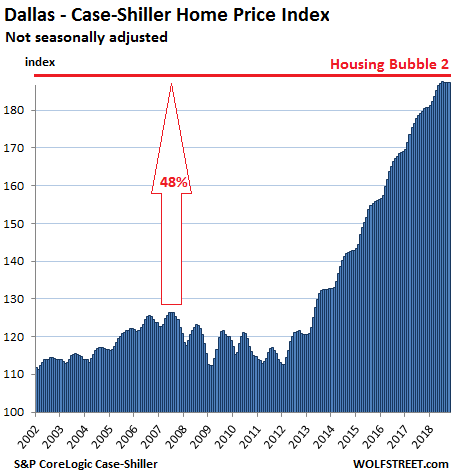
Dallas-Fort Worth:
House prices in the Dallas-Fort Worth metro in October were flat for the fourth month in a row, after a perfect run of 54 monthly increases in a row. The annual gain has been whittled down to 3.9% — from the 5.0% year-over-year gain in July. Since its peak during Housing Bubble 1 in June 2007, the index has surged 48%:
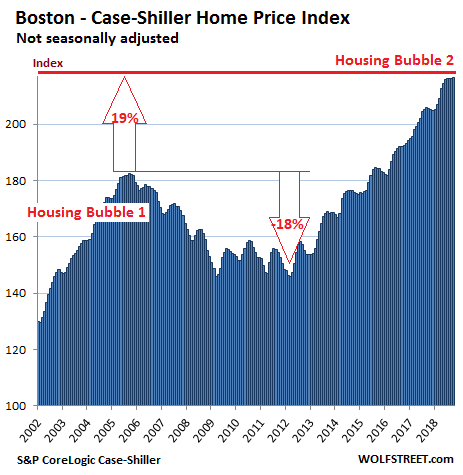
Boston:
The Case-Shiller Index for the Boston metro eked out a new all-time high in October, after having been essentially flat for three months. The index is up 5.4% from a year ago and exceeds the crazy peak of Housing Bubble 1 by 18.7%:
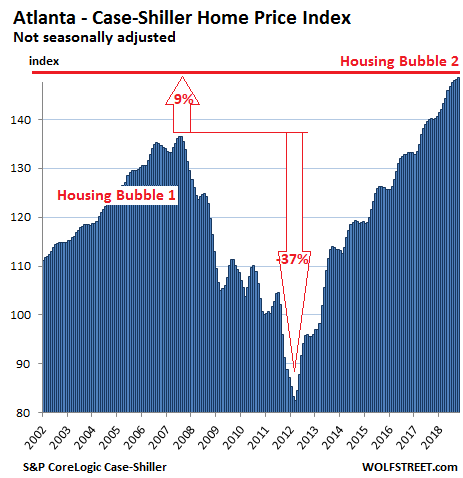
Atlanta:
House prices in Atlanta inched up to a new record in October and were up 6.0% from a year ago. So Atlanta’s housing bubble remains on track. The Case-Shiller index is now nearly 9% above the peak of Atlanta’s crazy Housing Bubble 1 in July 2007:
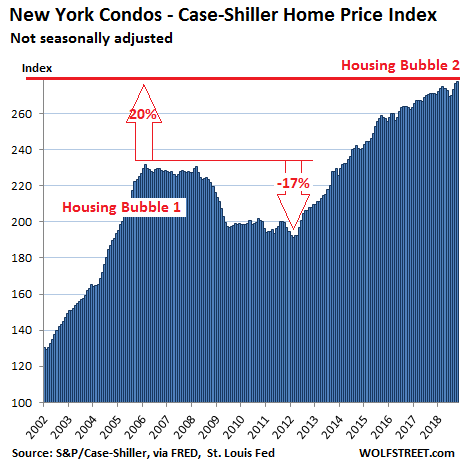
New York City Condos:
The Case-Shiller index for condo prices in the New York City metro, after ticking down several months in a row, has now jumped for the third month in a row. With the recent gains, it is now up 2.4% compared to October last year.