The market continues to be pumped with cheap money. Total market capitalization is breaking all the records in the history of the US GDP.
The Current Market Bubble
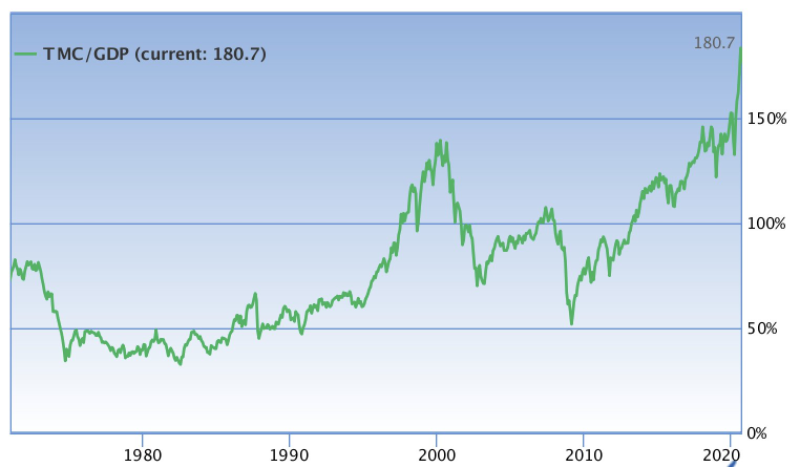
The data showed that the ratio of market capitalization to GDP exceeded the long-term average after reaching a 10-year low in the fiscal year of 2020. This suggests that the market may be moving towards an overheated zone, and it is best to be cautious.
The market cap is also thriving. Currently, markets closed by 180 percent of GDP. Investors’ activity has slowed down, as evidenced by the a low demand for purchases and sales. Sven Henrich, an expert and an investor, thinks this is the greatest financial bubble in history.
Congrats, market cap to GDP back above 180%. Total market valued at $35.8 trillion, the most expensive market in history.Bought for and sponsored by $17 trillion in incremental debt expansion since 2007 and a Fed balance sheet ballooning to $7 trillion and more to come.Sven Henrich @NorthmanTrader via Twitter
In contrast, most developed countries are consumed; about 70% of the United States. That is on the basis of GDP. With unemployment rates of many years high, discretionary budgets are supposed to be affected to a great extent, the Federal governments will end their domestic stimulus programs.
What Do these Numbers Mean?
The market cap-to-GDP ratio or ‘Warren Buffett Indicator’ calculates the average valuation of all the stocks on the exchange in comparison to the overall scale of the economy.
This hypothesis suggests that an unsustainable investment return could result in the market with a low market share-to-GDP ratio in the subsequent years, whereas a high-ratio market could create years with deceptive returns.
But, as with several rates, we realize that the economy is not necessarily going to collapse with a strong Buffet indicator. Likewise, the market isn’t inherently cheap by a low indicator.
Market experience has demonstrated that a stock market with a rising buffet metric will potentially get higher and remain “overvalued” for a long time before the inventory price ratings can be justified by the long-term economic growth.