by Dana Lyons

Based on one metric, the stock market’s current uptrend is the strongest in history – by far.
In our habitation within the investment-based social media realm, we have noticed a ongoing discussion between market observers related to the present stock rally. On the one hand, there is a loud chorus from folks (likely many of whom are frustrated non-participants in the rally) pointing out the unusual, and perhaps inorganic, nature of the incessant rally. On the other hand, you have the assured (condescending?) reminders from the other side (i.e., folks “killing it” at the moment) that an upward trajectory is the “normal” course of action for stocks, historically speaking. So which contingent is correct? They both are, to an extent.
Yes, it has been far more typical for stocks to rise than fall over the past 100-plus years. Thus, we should not be surprised by a rally, even in the face of elevated valuations, sentiment, etc. However, an unwillingness to acknowledge the noteworthy, even historic, nature of the current rally, would be an indication of either willful denial or potentially harmful ignorance.
This week, we take a look at some of the ways in which our current rally is truly unique from a broad historical basis. Today, we illustrate the historic strength of the current uptrend in the Dow Jones Industrial Average (DJIA). To put it bluntly, we are witnessing by far the strongest trend ever in the DJIA.
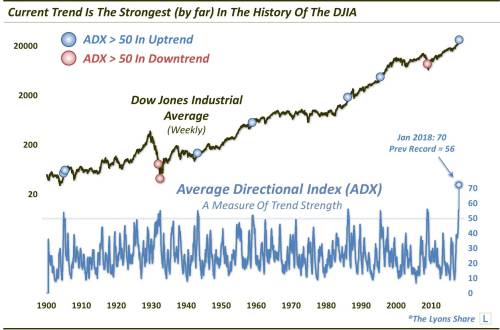
At least that is the message being sent by a technical indicator called the Average Directional Movement, or “ADX”. The ADX measures the strength of the current trend in a price series, whether up or down. Traditionally, one rule of thumb is that ADX (14-period) readings over 30 are an indication of an especially strong trend. If we look a weekly plot of the DJIA going back to 1900, we find ADX readings above 30 roughly 25% of the time. We also note a handful of readings, 10 to be exact, in which the ADX reached the 50 level, with a high of 56 in 1986 and 2008 (see the chart below). Those readings truly represent historic extremes in terms of trend strength. Then you have the current reading.
As of this week, the present reading of the ADX is 70. 70! That is far beyond anything we have witnessed in the history of the DJIA – and a testament to the unique nature of the current move.
What are the implications of this historic ADX reading? They say “the trend is your friend”, right? But has the pendulum swung so far that reversion in the way of a correction, or at least volatility, is in order? In a Premium Post at The Lyons Share, we dig a little deeper into the ADX from a quantitative and historical basis to see if we can gather any clues as to the meaning behind this epic reading.