Yesterday I warned that the stock market was due for a drop.
This morning stocks are a sea of red.
How did I know this was coming?
Breadth told me.
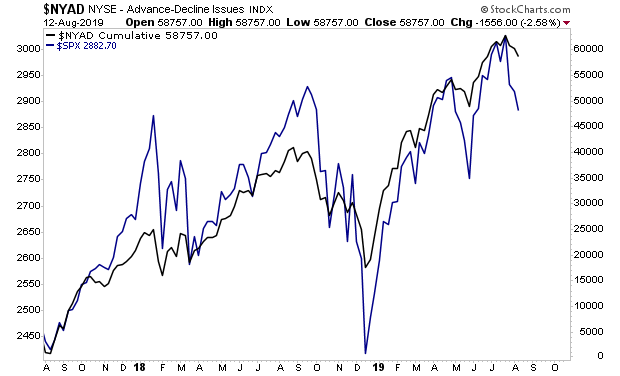
The single most important chart for the stock market is the NYSE’s breadth. This ALWAYS and I do mean ALWAYS leads the broader market.
When breadth outperforms the S&P 500 to the upside, stocks catch up by rallying. And when the breadth underperforms the S&P 500, stocks tend to collapse.

Put simply, if you want to know what stocks will do, you NEED to look at breadth
With that in mind, breadth has broken a bearish rising wedge formation. This is an EXTREMELY bearish development for stocks.

This is telling us stocks are going DOWN, possibly quite a lot.
And we’ll be profiting from it.
On that note, we are already preparing our clients for this with a 21-page investment report titled the Stock Market Crash Survival Guide.
In it, we outline the coming collapse will unfold…which investments will perform best… and how to take out “crash” insurance trades that will pay out huge returns during a market collapse.
Today is the last day this report will be available to the general public.
To pick up one of the last remaining copies…
https://www.phoenixcapitalmarketing.com/stockmarketcrash.html
Best Regards
Graham Summers
Chief Market Strategist
Phoenix Capital Research