by Dana Lyons

Despite the recent string of Nasdaq new highs, more stocks have been declining than advancing.
One of the hallmarks of the post-election “Trump Rally” in stocks has been the fairly broad participation. With a few exceptions, most sectors and style groups have gone along for the ride, resulting in breakouts to new high ground among most mainstream indices. However, there are signs that such broad strength has begun to thin. For example, the last few days have witnessed a development in sharp contrast to that prior positive breadth. Looking at the Nasdaq specifically, we see that the Nasdaq Composite has made a 52-week high on each of the past 3 days. Despite the new highs, however, each of those 3 days saw more declining issues on the Nasdaq exchange than advancers.
As you might expect, such a streak is rare. Indeed, similar 3-day runs have only occurred 2 other times since 1988 (and perhaps longer). Those dates were July 13, 1998 and February 28, 2012. And while 3 days of diverging internals isn’t necessarily a long-term death knell for the rally, it isn’t a healthy condition either. Following the prior occurrences, the Nasdaq was able to rally another week in the former case and another month in the latter before succumbing to 25% and 10% pullbacks, respectively.
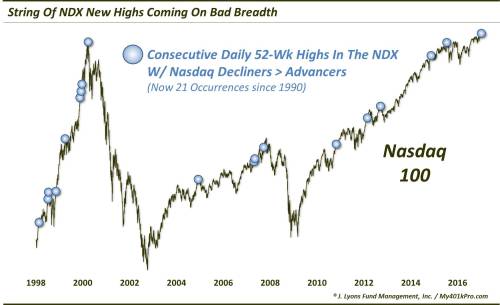
2 precedents is not a lot to go on, however, so we took a look at all streaks of at least 2 days in which either the Nasdaq Composite or the Nasdaq 100 (NDX) closed at a 52-week high with negative breadth on each day. That produced 20 prior occurrences going back to 1990. Two of them occurred in 1995 and 1996 and did not lead to more than a hiccup in the ongoing Nasdaq bull market. The other occurrences, beginning in 1998, were not all as benign.
We typically show aggregate median or average returns based on these types of studies. However, given the hit-or-miss performance of the NDX following each of the prior specific occurrences, it wouldn’t be of much value. Rather, let’s take a look at some specific instances.
As mentioned, the 2 events in 1995-1996 were irrelevant as red flags and, in fact, the majority of events (barely) still saw the NDX higher from 1 day to 2 years out. However, as seen by looking at the chart, there have been some signals that were obviously well-timed warnings regarding the thinning new highs. These include occurrences immediately preceding bear markets in July 1998, March 2000, September 2007 and July 2015 (in some indices). There were also occurrences directly preceding pullbacks of 5%-10% in April 1999, December 2004 and September 2012.
Which will it be this time, false alarm or prescient warning? Again, we unfortunately do not have a crystal ball. We will point out that most of the dates mentioned above that preceded serious trouble had seen a more significant deterioration in the market’s internals leading up to the signal. They were not just “one-off” data anomalies, but more tipping points to an unhealthy condition that had been building for some time.
And while this very recent run of lagging internals is certainly not a healthy condition, we would definitely not characterize the larger market environment as experiencing a large-scale internal deterioration. The advance-decline lines on both the NYSE and the Nasdaq set new highs just last week. And many broad market indices, including small-caps and mid-caps are just coming off of new highs as well.
This doesn’t mean the market won’t correct here. This data point, again, is not a signal of health. But we would stop short of labeling it a sign of major or long-term concern just yet.