Wolf Richter wolfstreet.com, http://www.amazon.com/author/wolfrichter
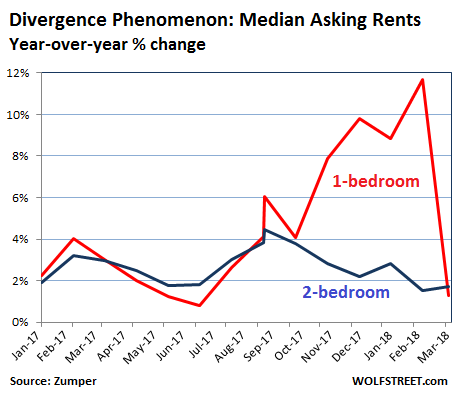
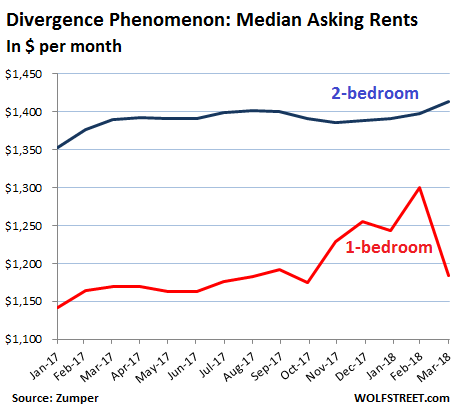
The peculiar phenomenon that started last November was this: One-bedroom median asking rents in the US were skyrocketing in the double-digits, even as two-bedroom rents were barely ticking up and remained below the rate of inflation – nearly unheard of in recent years. But it seems the final paroxysmwas in February, when one-bedroom rents had shot up 11.7% year-over-year to $1,300.
In March, the median 1-BR asking rent plunged 9% on a monthly basis to $1,184 to where it was up only 1.3% year-over-year. The median 2-BR asking rent rose only 1.7% from a year ago to $1,414. Whatever the reasons had been for this divergence between the red-hot growth of 1-BR rents and the tepid growth of 2-BR rents – there were several contenders – it’s over:
The data, provided by Zumper, is based on asking rents in multifamily apartment buildings, including new construction, as it appeared in active listings in cities across the US. Single-family houses and condos for rent are not included. Zumper releases the data in its National Rent Report.
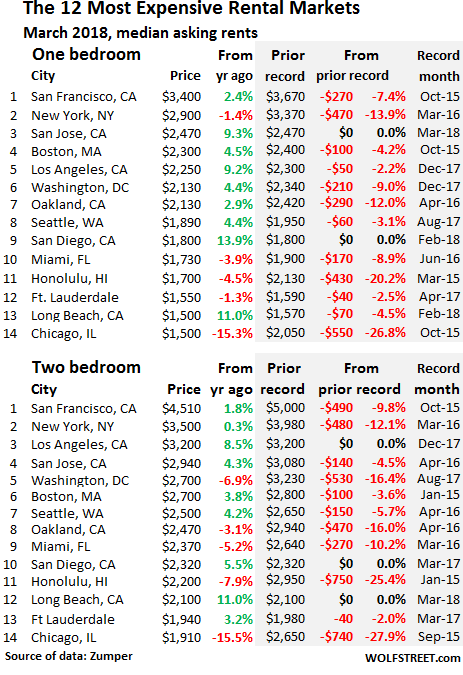
The most expensive markets cool off.
In the most ludicrously expensive major rental market in the US, San Francisco, the median asking rent for 1-BR apartments rose 2.4% year-over-year to $3,400 in March, but was down 7.4% from the peak in October 2015. For 2-BR apartments, the median asking rent rose 1.8% year-over-year to $4,510 but was down 9.8% from the peak in October 2015.
There is no housing shortage in San Francisco. For example, Zillow lists 1,581 apartments for rent, a 38% jump from the 1,149 apartments Zillow had listed in August 2016. This is a result of the construction boom. Note that there are only 386,755 total housing units in San Francisco (it’s not a big city). But almost all the new construction is high-end, most of the units on the market are too expensive, and people cannot afford them. Hence the local term, “Housing Crisis” – a crisis not of availability but of price.
In the second most expensive major rental market, New York City, the median asking rent for 1-BR apartments edged down 1.4% year-over-year to $2,900 and is down 13.9% from the peak in March 2016. 2-BR apartment rents edged up 0.3% to $3,500 but are down 12.1% from the peak in March 2016.
These median asking rents do not include incentives or “concessions,” such as “1 month free” or “2 months free,” which reduce the effective rent for the first year by 8% or 17%. Concessions have appeared in San Francisco and have reached record levels In New York City.
The table below shows the 14 most expensive major rental markets. The shaded area shows peak rents and the movements since then. There are now a number of double-digit declines from their respective peaks:
Formerly red-hot Seattle is perhaps a prime example of a phenomenal housing construction boom that went all high-end with no place to go. Rents seem to have hit a ceiling in 2016 or 2017.
Chicago is worrisome. Its place on this list above has plunged from eighth in September 2016 to 14th now, in line with the free-fall in rents that now approaches 30% from the peak in late 2015.
Rents in Honolulu might be groping for a bottom. The declines seem to have slowed down, though this could just be another blip, with sharper declines to follow.
There are three Bay Area cities on the above list. Rents in two of them (San Francisco and Oakland) are significantly down from the respective peaks. Oakland serves as escape for SF housing refugees, and rents had surged over the past few years, but now 1-BR and 2-BR rents have dropped 12% and 16% from their peak. In San Jose, however, 1-BR rents set a new record in March, but barely, and are down only 4.5% from the peak.
There are three Southland cities on the above list – Los Angeles, San Diego, and Long Beach. And rents in all three of them have been setting new records.
Across the country, every market is different, and the national average glosses over the surges and plunges – often in the double digits. And there is some real drama going on in the less expensive markets. The percentages are based on year-over-year (Y/Y). Use the search function in your browser to look for a specific city in Zumper’s list of the 100 most expensive rental markets:
| City | 1 BR Rent | Y/Y % | 2 BR Rent | Y/Y % | |
| 1 | San Francisco, CA | $3,400 | 2.40% | $4,510 | 1.80% |
| 2 | New York, NY | $2,900 | -1.40% | $3,500 | 0.30% |
| 3 | San Jose, CA | $2,470 | 9.30% | $2,940 | 4.30% |
| 4 | Boston, MA | $2,300 | 4.50% | $2,700 | 3.80% |
| 5 | Los Angeles, CA | $2,250 | 9.20% | $3,200 | 8.50% |
| 6 | Oakland, CA | $2,130 | 2.90% | $2,470 | -3.10% |
| 6 | Washington, DC | $2,130 | 4.40% | $2,700 | -6.90% |
| 8 | Seattle, WA | $1,890 | 4.40% | $2,500 | 4.20% |
| 9 | San Diego, CA | $1,800 | 13.90% | $2,320 | 5.50% |
| 10 | Miami, FL | $1,730 | -3.90% | $2,370 | -5.20% |
| 11 | Honolulu, HI | $1,700 | -4.50% | $2,200 | -7.90% |
| 12 | Fort Lauderdale, FL | $1,550 | -1.30% | $1,940 | -2.00% |
| 13 | Chicago, IL | $1,500 | -15.30% | $1,910 | -15.50% |
| 13 | Long Beach, CA | $1,500 | 11.10% | $2,100 | 11.10% |
| 15 | Philadelphia, PA | $1,470 | 6.50% | $1,640 | 3.10% |
| 16 | Atlanta, GA | $1,430 | 7.50% | $1,840 | 9.50% |
| 17 | Denver, CO | $1,400 | 15.70% | $1,910 | 13.70% |
| 18 | Minneapolis, MN | $1,390 | 3.00% | $1,850 | 12.80% |
| 19 | Providence, RI | $1,380 | -0.70% | $1,440 | -2.70% |
| 20 | Portland, OR | $1,370 | 2.20% | $1,590 | -0.60% |
| 21 | New Orleans, LA | $1,360 | 0.00% | $1,410 | -6.60% |
| 22 | Baltimore, MD | $1,320 | 14.80% | $1,520 | 15.20% |
| 23 | Nashville, TN | $1,310 | 7.40% | $1,440 | 9.10% |
| 24 | Dallas, TX | $1,300 | -1.50% | $1,760 | -1.70% |
| 25 | Houston, TX | $1,290 | 12.20% | $1,630 | 14.00% |
| 25 | Scottsdale, AZ | $1,290 | 2.40% | $2,010 | -8.20% |
| 27 | Madison, WI | $1,200 | 4.30% | $1,360 | 7.90% |
| 28 | Orlando, FL | $1,180 | 15.70% | $1,390 | 15.80% |
| 29 | Sacramento, CA | $1,170 | 9.30% | $1,400 | 11.10% |
| 30 | Austin, TX | $1,160 | 10.50% | $1,450 | 9.00% |
| 31 | Charlotte, NC | $1,150 | 0.00% | $1,290 | 1.60% |
| 32 | Irving, TX | $1,140 | 6.50% | $1,540 | 12.40% |
| 32 | Tampa, FL | $1,140 | 14.00% | $1,340 | 9.80% |
| 34 | Aurora, CO | $1,120 | 9.80% | $1,410 | 3.70% |
| 34 | Plano, TX | $1,120 | 5.70% | $1,500 | 4.90% |
| 36 | Virginia Beach, VA | $1,090 | 16.00% | $1,200 | 4.30% |
| 37 | Gilbert, AZ | $1,070 | 5.90% | $1,330 | 3.10% |
| 38 | Fort Worth, TX | $1,060 | 11.60% | $1,260 | 14.50% |
| 39 | Chandler, AZ | $1,050 | 10.50% | $1,250 | 8.70% |
| 39 | Newark, NJ | $1,050 | 14.10% | $1,250 | 6.80% |
| 39 | Pittsburgh, PA | $1,050 | 1.00% | $1,280 | -1.50% |
| 39 | Richmond, VA | $1,050 | 7.10% | $1,210 | 10.00% |
| 43 | Chesapeake, VA | $1,040 | 14.30% | $1,200 | 4.30% |
| 44 | Durham, NC | $1,030 | 10.80% | $1,170 | 13.60% |
| 44 | Henderson, NV | $1,030 | 6.20% | $1,200 | 7.10% |
| 46 | Salt Lake City, UT | $1,020 | 15.90% | $1,260 | 9.60% |
| 47 | Raleigh, NC | $1,010 | 0.00% | $1,170 | 1.70% |
| 48 | Buffalo, NY | $990 | 10.00% | $1,150 | -8.70% |
| 49 | St Petersburg, FL | $980 | 14.00% | $1,620 | 14.10% |
| 50 | Kansas City, MO | $960 | 4.30% | $1,040 | 11.80% |
| 51 | Phoenix, AZ | $950 | 9.20% | $1,140 | 8.60% |
| 52 | Jacksonville, FL | $930 | 9.40% | $1,050 | -2.80% |
| 53 | Las Vegas, NV | $910 | 15.20% | $1,050 | 11.70% |
| 54 | Baton Rouge, LA | $900 | -1.10% | $940 | -1.10% |
| 54 | Fresno, CA | $900 | 5.90% | $1,050 | 10.50% |
| 56 | Mesa, AZ | $880 | 11.40% | $1,010 | 3.10% |
| 56 | Milwaukee, WI | $880 | 10.00% | $990 | 15.10% |
| 56 | San Antonio, TX | $880 | 6.00% | $1,140 | 5.60% |
| 59 | Boise, ID | $870 | 7.40% | $950 | 2.20% |
| 59 | Colorado Springs, CO | $870 | 10.10% | $1,050 | 0.00% |
| 59 | Louisville, KY | $870 | 8.70% | $950 | 13.10% |
| 62 | Anchorage, AK | $860 | -5.50% | $1,100 | -4.30% |
| 62 | Corpus Christi, TX | $860 | 8.90% | $1,070 | 11.50% |
| 64 | Syracuse, NY | $850 | 13.30% | $930 | -2.10% |
| 65 | Cincinnati, OH | $830 | 12.20% | $1,070 | 11.50% |
| 65 | Omaha, NE | $830 | 13.70% | $970 | 7.80% |
| 67 | Rochester, NY | $820 | 15.50% | $1,000 | 13.60% |
| 68 | Reno, NV | $800 | 14.30% | $1,170 | 15.80% |
| 69 | Laredo, TX | $790 | 8.20% | $940 | 9.30% |
| 70 | Arlington, TX | $770 | 10.00% | $1,020 | 10.90% |
| 70 | Chattanooga, TN | $770 | 10.00% | $810 | 12.50% |
| 70 | Knoxville, TN | $770 | 14.90% | $870 | 13.00% |
| 73 | Bakersfield, CA | $760 | 10.10% | $890 | 6.00% |
| 73 | Des Moines, IA | $760 | 1.30% | $800 | -1.20% |
| 75 | Glendale, AZ | $750 | 7.10% | $900 | 2.30% |
| 75 | Lexington, KY | $750 | -6.30% | $940 | 1.10% |
| 75 | St Louis, MO | $750 | 10.30% | $1,060 | 11.60% |
| 78 | Cleveland, OH | $730 | 15.90% | $800 | 14.30% |
| 78 | Norfolk, VA | $730 | 10.60% | $930 | 3.30% |
| 80 | Augusta, GA | $710 | 14.50% | $790 | -1.30% |
| 80 | Spokane, WA | $710 | 7.60% | $900 | 8.40% |
| 82 | Tallahassee, FL | $700 | 11.10% | $830 | 6.40% |
| 82 | Winston Salem, NC | $700 | 1.40% | $760 | 8.60% |
| 84 | Greensboro, NC | $680 | 13.30% | $810 | 5.20% |
| 84 | Indianapolis, IN | $680 | 15.30% | $760 | 11.80% |
| 84 | Oklahoma City, OK | $680 | 11.50% | $820 | 5.10% |
| 87 | Columbus, OH | $670 | 3.10% | $1,000 | 5.30% |
| 87 | Tucson, AZ | $670 | 11.70% | $820 | 2.50% |
| 89 | Memphis, TN | $660 | 13.80% | $720 | 14.30% |
| 90 | Albuquerque, NM | $630 | 5.00% | $800 | 5.30% |
| 90 | El Paso, TX | $630 | -1.60% | $770 | 0.00% |
| 92 | Lincoln, NE | $610 | -9.00% | $810 | 0.00% |
| 92 | Shreveport, LA | $610 | 5.20% | $650 | 1.60% |
| 94 | Tulsa, OK | $600 | 5.30% | $750 | 2.70% |
| 94 | Wichita, KS | $600 | 15.40% | $690 | 4.50% |
| 96 | Akron, OH | $590 | 11.30% | $700 | 4.50% |
| 96 | Lubbock, TX | $590 | 1.70% | $750 | 7.10% |
| 98 | Detroit, MI | $560 | 3.70% | $630 | -3.10% |
| 99 | Fort Wayne, IN | $540 | 12.50% | $610 | 10.90% |
| 100 | Toledo, OH | $530 | 15.20% | $640 | 14.30% |
Where are the Most Splendid House Price Bubbles in the US? City by city, with some flat spots disappearing, new ones forming. Read… Update on the Most Splendid Housing Bubbles in the US