by Dave
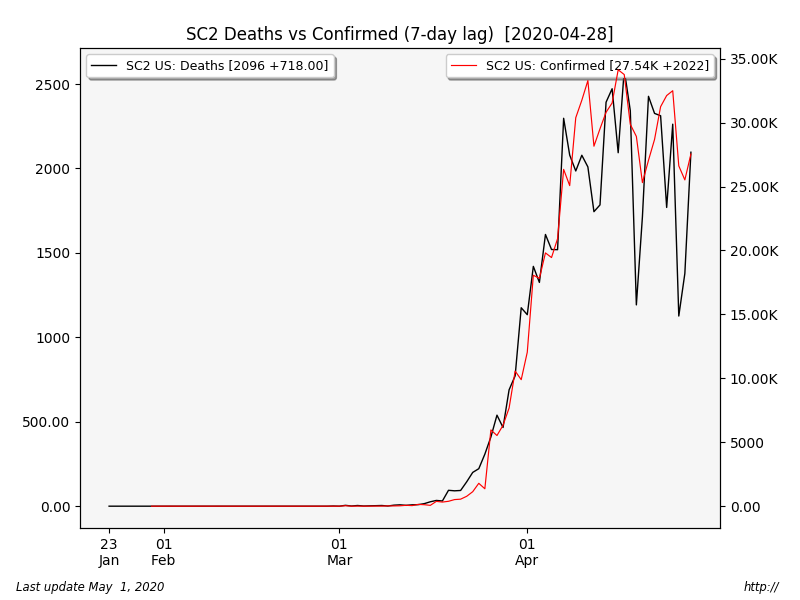
Here’s a chart on confirmed vs deaths – with “confirmed” lagged by 7 days, just to see how they line up. So deaths are used to set the bottom axis dates, but the confirmed timeseries dates are pushed “to the right” by 7 days.
Just thought it was interesting. On average, a “confirmed case” takes 7 days to die?
It does seem reasonably likely that we are past peak — deaths. We just saw a lower high and a lower low in the deaths series, and that says we have changed trend there. Testing earlier, no overwhelm, better treatments.

Here’s the standard chart. We just made a “higher high” in the confirmed series.

0 views