The Bear Trader, a spin off from the Bull & Bear Tracker, is ready to profit from a sudden and swift correction for the market which will soon arrive. The charts below are the danger signs which indicate that the speculative animal spirits are alive well.
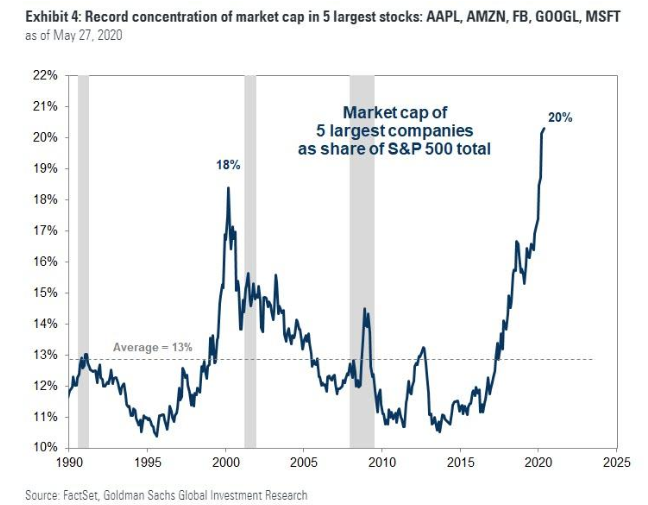
The chart below depicts that the five leading tech stocks account for more the S&P 500’s market cap than the 2000 bubble.

The first chart below depicts that investors spent $1 billion to drive Hertz car rental shares from less than a $1 to over $3 on Friday June 5, 2020. Unfortunately, the investors who invested did not read the fine print. The second chart below for May 26, 2020 depicts Hertz’s share price falling from above $3.00 to below $1.00 after it filed for bankruptcy.


The final chart depicts the put to call ratio for the S&P 500. The gold or orange line is the S&P 500. The blue line is the put to call ratio. It’s a contrary indicator. When much more call options than put options are bought it indicates that the market is overbought. When much more put options than call options are being bought the market is oversold.
The ratio reached a high in January 2020, as per the red shaded circle indicating that the market was overbought. The blue shaded circle at the bottom depicts March 2020. It indicates that the S&P 500 was oversold. The yellow shaded circle on the right indicates that the market is ripe for a correction.
