The Fed’s own data on the distribution of wealth in the US is a quarterly report card on the Fed’s official policy goal of the “Wealth Effect.” It has now released the data for Q4. The Fed uses monetary policies, such as QE and interest rate repression, to create asset price inflation and make a relatively small number of large asset holders vastly wealthier so that they might spend more. This has been explained in numerous Fed papers, including by Janet Yellen back when she was still president of the San Francisco Fed.
The Fed’s wealth distribution data divides the US population into four groups by wealth: The “Top 1%,” the “2% to 9%,” the “next 40%,” and the “bottom 50%.” My Wealth Effect Monitor divides this data by the number of households in each category, to obtain the average wealth per household in each category. Note the immense increase in the wealth for the 1% households after the Fed’s money-printing scheme and interest rate repression started in March 2020:
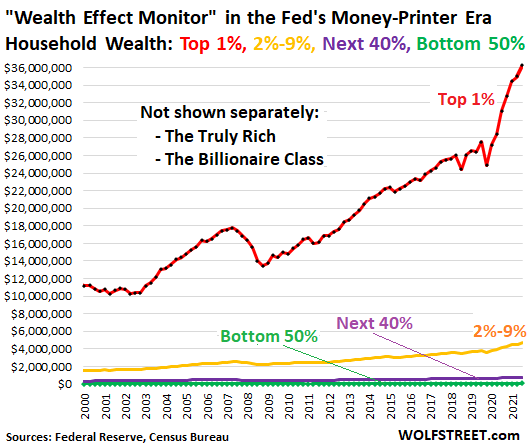
As you can see from the steep curve of the red line, the “Top 1%” households were the primary beneficiaries of the Fed’s policies since March 2020. These policies were designed to inflate asset prices, and only asset holders benefited from that. The more assets they held, the more they benefited.
So here is the average wealth (= assets minus debts) per household, by category in Q4, 2021:
- “Top “1%” household (red): $36.2 million.
- The “2% to 9%” household (yellow): $4.68 million.
- The “next 40%” household (purple): $775,000.
- The “bottom 50%” household (green): $59,000.
But wait… durable goods.
The Fed includes durable goods in this wealth. Durable goods are motor vehicles, boats, furniture, electronics, etc. They’re consumables – unless they’re art, antiques, or classics – and their value will ultimately go to zero. For the “bottom 50%,” their durable goods account for nearly 20% of their total assets and for nearly 50% for their total wealth (assets minus debts).
The Billionaire Class got more billions.
The Fed doesn’t provide separate data on the truly rich (the 0.01%) and the Billionaire Class, a distinct royalty-like class in American society whose names often have the royal title of “billionaire” in front. They’re the biggest beneficiaries of the Fed’s monetary policies.
The top 30 US billionaires have a total wealth of $2.12 trillion, sliced into 30 slices for a wealth of $70.8 billion per billionaire, according to the Bloomberg Billionaires Index.
Compare that to the bottom half of the US population – the “bottom 50%” – who have a combined wealth of just $3.7 trillion, sliced into 165 million slices for each individual. For them, the inflated real estate prices just mean higher housing costs.
Reckless usage of percentages can kill someone.
If I give my favorite homeless guy $5, and he already has $5 in his pocket, I increased his wealth by 100%, which is a huge percentage jump in wealth. But he’s still homeless and still doesn’t have any wealth.
Percentage increases are regularly touted to show that the wealth at the bottom increased, when in fact, it increased by only minuscule amounts of dollars because the bottom 50% have so little that even a big percentage increase still amounts to nearly nothing in dollar terms, compared to the billionaire class.
When the wealth of the bottom 50% increases by 5%, they gain about $3,000. And when the average wealth of the top 30 billionaires increases by 5%, they on average gain $3,500,000,000. And the wealth disparity just blew out.
Greatest economic injustice committed in recent US history.
Since March 2020, the Fed printed $4.9 trillion and repressed short-term interest rates to near-zero in order to inflate asset prices so that the asset holders would get immensely more wealthy, in line with its doctrine of the Wealth Effect.
This act has produced the greatest economic injustice committed in recent US history.
My “Wealth Disparity Monitor” tracks that economic injustice on a quarterly basis by showing the difference in average wealth between the top 1% and the bottom 50%, per household, based on the Fed’s own data.
In 1990, the wealth disparity between the average “top 1%” household and the average “bottom 50%” household was $5 million. In Q4 2021, it ballooned by another $1.2 million from the prior quarter, and by $5.1 million year-over-year, to $36.2 million.
Since the Fed’s crazed money printing binge and interest rate repression started in March 2020, the wealth disparity between the average “top 1%” household and the average “bottom 50%” household has exploded by $11.2 million per household.

More wealth for the wealthy, paid for by crushing inflation for the rest.
The Fed’s policy of the Wealth Effect operates by creating asset price inflation through money printing and interest rate repression.
The bottom 50% of Americans — who spend all or nearly all their income on housing, transportation, food, healthcare, etc. — hold practically no stocks, no bonds, and very little real estate, according to the wealth distribution data from the Federal Reserve. When the Fed purposefully inflates those assets that only some people in society hold, it says F-U to the rest.
And this money-printing binge has now created the worst inflation in 40 years. Inflation destroys the purchasing power of the dollar, and it destroys the purchasing power of labor denominated in dollars. Just to get by, the bottom 50% spend all, or nearly all, of their income on consumer items – such as housing, transportation, and food. And they got mauled by this rampant consumer price inflation that this money printing has triggered. And they’re the ones paying for this act of the Fed to enrich the asset holders.
So average wages and salaries went up a lot, but by only a fraction of the amount that rents, and the prices of houses, used and new vehicles, gasoline, groceries, etc. shot higher. And the worker bees in this economy now have to tighten their belts further even as richest asset holders got vastly wealthier, thanks to the Fed’s policies.