Wolf Richter wolfstreet.com, www.amazon.com/author/wolfrichter
I don’t expect a “monetary shock” now. But maybe later.
Back in October 2015, the three-month Treasury yield was 0%. Many on Wall Street said that the Fed could never raise interest rates, that the zero-interest-rate policy had become a permanent fixture, like in Japan, and that the Fed could never unload the securities it had acquired during QE. How things have changed!
On Friday, the three-month Treasury yield closed at 1.78%, the highest since August 19, 2008. When yields rise, by definition bond prices fall:
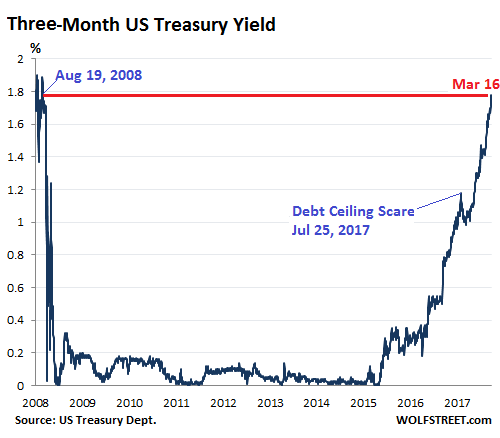
The Fed’s target range for the federal funds rate has been 1.25% to 1.50% since its last rate hike at the December FOMC meeting. In other words, the three-month yield is already above the upper limit of the Fed’s target range after the next rate hike. So the market has fully priced in a rate hike at the FOMC meeting ending March 21. And it’s also starting to price in another rate hike in June.
No “monetary shock” now, but maybe later
In this rate-hike cycle, the Fed has engaged in policy action only at meetings that are followed by a press conference. There are four of these press-conference meetings per year. The next two are this week and June.
If, in this cycle, the Fed hike rates at an FOMC meeting that is not followed by a press conference – there are also four of them this year – it would be considered a “monetary shock” that the Fed decided to administer to the markets. It would be like a rate hike of 50 basis points instead of the expected 25 basis points. There would be a hue and cry in the markets around the world. But I think the Fed isn’t ready to spring that on the markets just yet. Maybe later.
The two-year yield rose to 2.31% on Friday, the highest since August 29, 2008
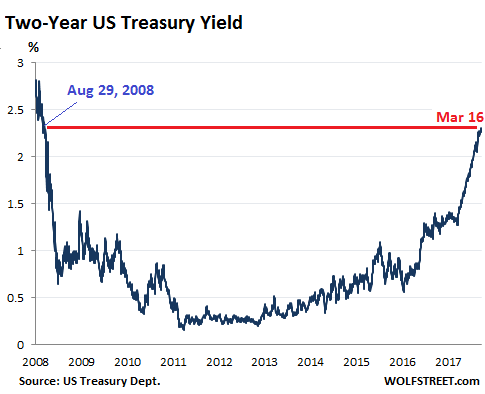
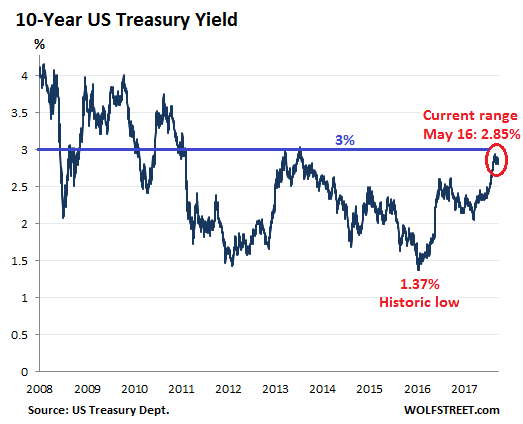
In past rate hike cycles, the two-year yield reacted faster to rate-hike expectations than the 10-year yield. This is happening now as well. The 10-year yield has its own dynamics that are not in lockstep with the Fed’s rate-hike scenario. On Friday, the 10-year yield closed at 2.85%, within the same range where it had been since late February, tantalizingly close to 3%:
Bearish bets against Treasuries leave skid marks
Back on February 13, as the 10-year Treasury yield was surging and threatened to take out the 3% level, I postulated that it would have a hard time doing so over the near term, for two reasons:
One, in the 3%-range – given current asset prices, dividend yields, etc. – the 10-year Treasury is appealing to more buyers, and this will keep bond prices from falling further, thus putting a lid on the yield.
Two, speculators were heavily betting against the 10-year Treasury. By mid-February, bearish bets had risen to about 960,000 contracts, an all-time record. On February 21, the 10-year yield reached 2.95%. Everyone was on the same side of the boat. And there would have to be a sharp snap-back rallythat could turn into a short-squeeze.
So we have seen some of both, and the 10-year yield remains stuck until further notice.
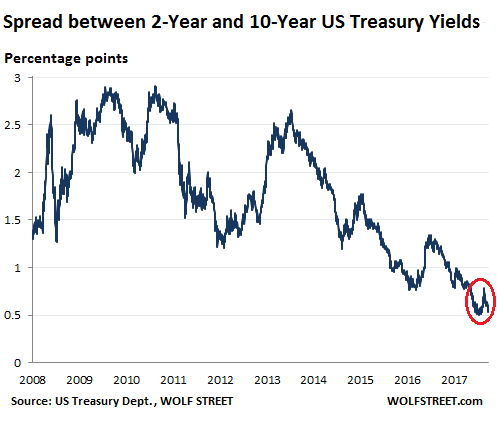
After the surge of the two-year yield, the difference between the two-year and the 10-year yield – the “two-10 spread” – has narrowed again. On Friday, it was at 54 basis points. In the chart below, note the narrowing at the end of last year to 50 basis points, then the mini-spike, as the 10-year yield surged faster than the two-year yield, and the recent fallback:
Where does this leave the yield curve?
The chart below shows the “yield curves” as the yields across the maturity spectrum occurred on these five key dates:
- On Friday, March 16 (solid red line)
- On February 21 (dotted red line) when the 10-year yield closed at 2.95%.
- On December 29, 2017 (black line), before the 10-year yield started surging.
- On August 29, 2017 (green line) two weeks before the QE unwind was detailed.
- On December 14, 2016 (blue line) when the Fed stopped flip-flopping and started raising rates like clockwork.
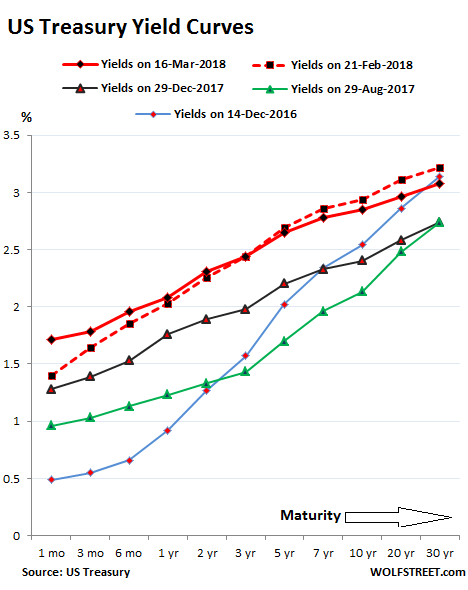
Note how the spread widened toward the long-dated end (right side of chart) between the black line (December 29, 2017) and the dotted red line (February 21), with the 30-year yield surging 48 basis points over those seven weeks, and how the slope of the dotted red line steepened compared to the black line.
These yields at the long end have since reversed slightly, but short-term yields have surged, leaving the yield curve on Friday (solid red line) somewhat flatter than it had been on February 21.
But I do not think that the yield curve will “invert” – a phenomenon when short-term yields are higher than long-term yields, which has been closely associated with recessions or worse. The last such inverted yield curve occurred before the Financial Crisis.
This time, the Fed has a tool that it didn’t have before: During QE, it acquired $1.7 trillion in Treasuries and $1.8 trillion in mortgage-backed securities that it has now started to unload. It can start jawboning the markets by telling them that it will unload the securities more quickly, and it could then actually unload them more quickly. This would be a “monetary shock.” It would put a lot of pressure on long-term Treasuries, and yields would jump at the long end of the curve, thus steepening the yield curve and causing all kinds of turbulence.
It may already be in the works. The first Fed Governor came out and said that the QE Unwind isn’t fast enough. And because it’s so slow it may actually contribute to, rather than lower, “financial imbalances.” Read… QE Unwind Is Too Slow, Says Fed Governor, Thus Launching First Trial Balloon