by Guest Author
Due to my recent findings from researching the empirical data of prior market crashes since 1901, investors in the future will be able to distinguish a crash from a correction. All crashes and corrections can now be measured and categorized.
The chart below for the NASDAQ from 2000 to 2020 depicts:
- 2000 & 2020-bull market crashes: A declines of 10% or greater within five days from a high is the beginning of a crash and not a correction. The 2000 NASDAQ bull declined by 10% within a three-day period after it reached its final pre-crash high. The 2020 bull declined by 11.9% within five days after reaching its final pre-crash high.
- 2008-bear market correction: Declines which occur after a bear market has begun are corrections and not crashes. The two good examples are the NASDAQ 2000 and NASDAQ 2007, corrections before they bottomed in 2002 and 2009 respectively. The decline for the NASDAQ 2000’s final correction to the bottom was 47%.
- 2018-bull market correction: An initial correction of less than 10% within a five-day period from the high is a bull market correction. The 2018 bull is a good example. Its decline from the high was 7.5%.

According to the SCPA (Statistical Crash Probability Analyses) algorithm, the probability is 100% for:
- The relief rally high to occur anytime from April 3, 2020, to April 14, 2020.
- After the indices reach their highs they reverse and decline to within 41% to 44% of their highs by late April or early May 2020.
Since March 23rd when the indices were 34% below their 2020 highs, they have climbed back to within 20% of their highs.
Take advantage of the powerful relief rally. Liquidate everything except for stocks under $5 per share by Tuesday, April 14th. Suggest that 20% of portfolio holdings be sold per day for the next five days. Do not procrastinate. The market can stop on a dime and turn downward.
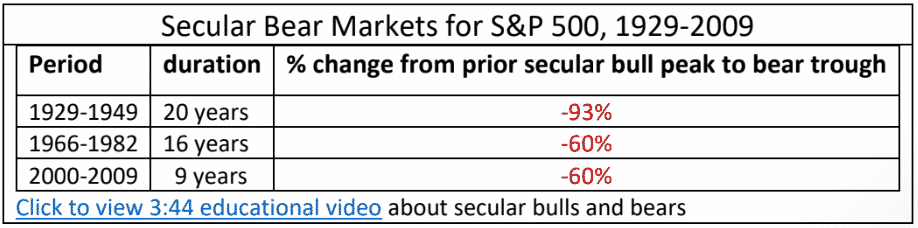
My prediction is that the S&P 500’s secular bull market which began in March 2009 ended on February 19, 2020. The ninth secular bear since 1802 began on February 20th. Based on the peaks of the last three secular bull markets as compared to the troughs of the three most recent secular bears, the S&P 500 could decline by an additional 47% to 80% from its March 6, 2020 close.