Students, go to Fred and type in PPI Final Demand. Create a chart and choose Change From Year Ago.
What you will find is that the PPI Final Demand is up 16.8% in May since the same month last year.

Consumer purchasing power keeps declining since the creation of The Federal Reserve System in 1913. This chart shows the decline in purchasing power since the peak of the housing bubble in 2005.

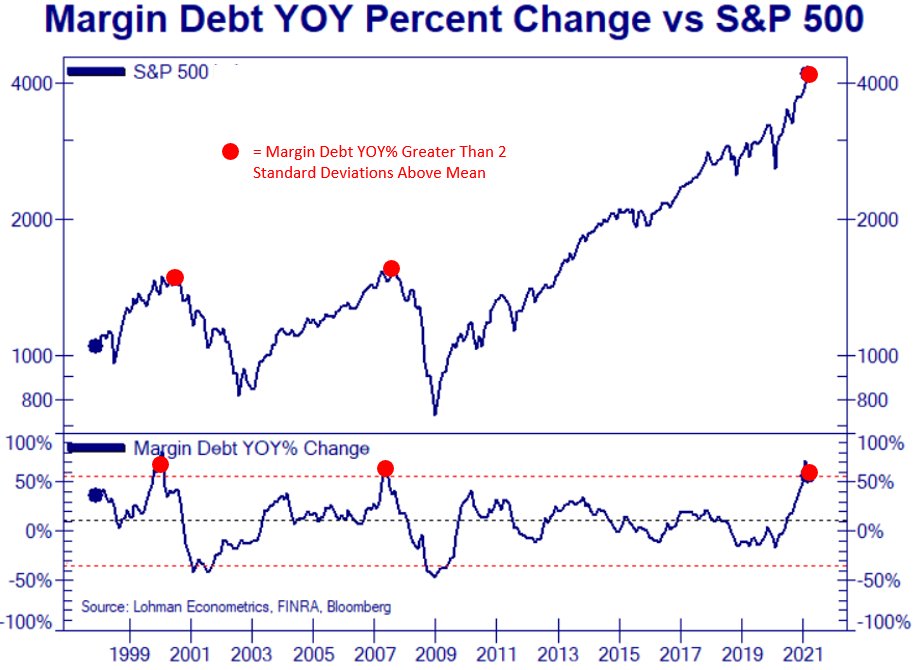
Margin debt hits another all-time high.
Now ain’t this a kick in the head.
Views: