via Lu Wang
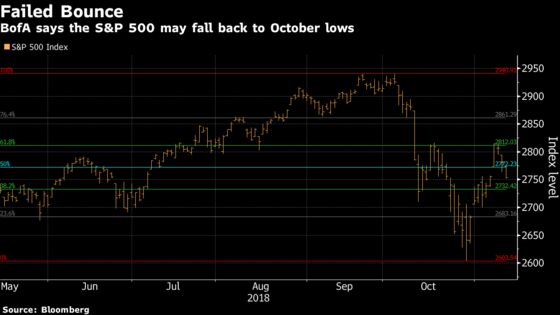
A two-week bounce in U.S. stocks failed a key technical level, a sign that the S&P 500 may test its October lows, according to Bank of America Corp.
While the benchmark index ended last week with another rally of more than 2 percent, the ascent faltered around 2,815, a level that halted a similar recovery attempt in mid October and represented a 61.8 percent retracement of the entire decline from the September peak. A daily sell signal on Friday based on Tom Demark’s market-timing indicators suggested that resistance is likely to hold, said Stephen Suttmeier, BofA’s technical analyst.
The repeated failure at resistance added to a list of other warning signs that the market has flagged over the past month. Among them, the S&P 500 broke its 40-week average for the first time in two years during the October rout, an indication that the rally that took the index up as much as 60 percent from its 2016 trough is running out of steam. Meanwhile, market breadth and sentiment suggest bulls have yet to give up, and that a bottom has been set.
“Late stage bull market behavior and a failure at resistance, along with the lack of full capitulation … on the October decline increase the risk of a retest or undercut of the lows near 2,600,” Suttmeier wrote in a note to clients. The market “remains within challenging pattern,” he added.
Suttmeier is the latest among Wall Street technical analysts who warn that stocks aren’t out of the woods yet. Last week, Jeff deGraaf of Renaissance Macro Research urged investors not to chase the rally as the rebound from the October sell-off showed signs of fatigue.
U.S. stocks suffered the worst month in seven years in October, with the S&P 500 dipping as low as 2,603.54 on Oct. 29, before staging a rally that erased more than half of the decline and reclaimed its 40-week moving average. Since then, the index has fallen three straight days. At 2,750 as of 10:50 a.m. in New York, it’s again below that long-term trend.