Wolf Richter wolfstreet.com, http://www.amazon.com/author/wolfrichter
And how would the housing market digest these kinds of mortgage rates?
In this cycle, the Fed has hiked its target range for the federal funds rate only after meetings that were followed by a press conference. There are four of them scheduled this year – the first one on March 14-15. So, next time the Fed may nudge up its target range (currently 1.25%-1.50%) is 6 weeks away.
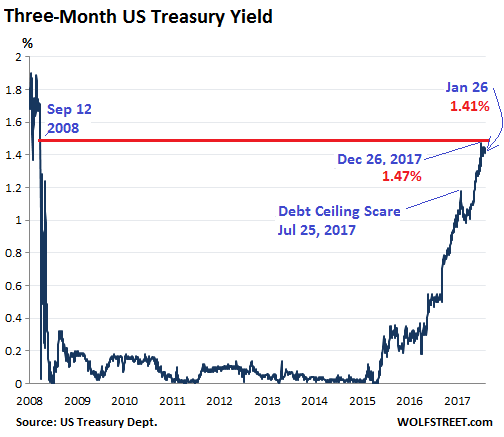
The one-month yield of US Treasury securities has vacillated around 1.25% since the last rate hike in December, closing on Friday at 1.24%. The three-month yield has vacillated above 1.4% for a month, closing on Friday at 1.41%. So this end of the curve is waiting till the propitious decision on March 15 gets closer:
About $14.8 trillion of the US government’s $20.5 trillion in debt is publicly traded (the remaining $5.7 trillion is held by internal accounts of the US government, such as Social Security). This makes the Treasury market the most liquid bond market in the world, and its benchmark yields underpin a number of other markets, including the mortgage market.
And unlike Treasuries with shorter maturities, Treasuries with longer maturities have moved in recent weeks, with prices falling and yields rising.
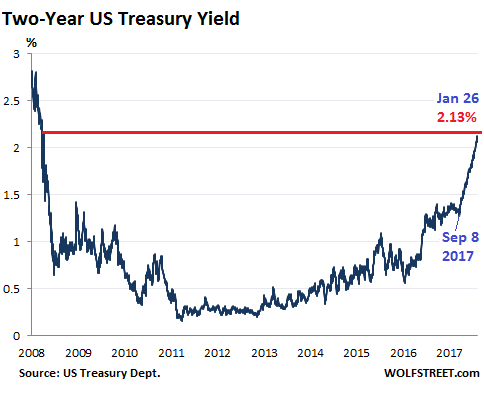
The two-year yield jumped 5 basis points to 2.13% on Friday, the highest since September 2008, continuing the spike that started on September 8, 2017, shortly before the Fed announced the QE Unwind start-date:
The whole mid-range of the yield curve has moved up. The five-year yield jumped 6 basis points to 2.47% on Friday. The seven-year yield rose 5 basis points to 2.60%, up from 2.33% at the end of December.
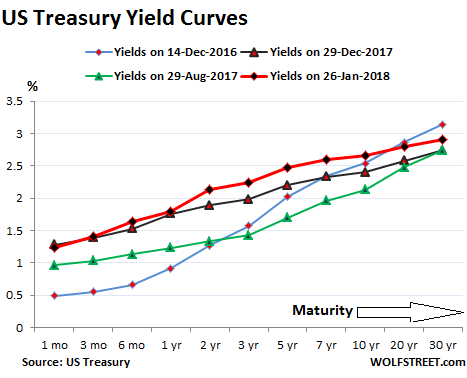
The chart below shows the “yield curves” as they occurred on these four dates:
- Yields on Friday, January 26, 2018 (red line)
- Yields on December 29, 2017 (black line)
- Yields on August 29, 2017 (green line) two weeks before the QE unwind was detailed.
- Yields on December 14, 2016 (blue line) when the Fed stopped flip-flopping, raised its rates, and became a clockwork.
Note how the gap has widened in the middle from the green line (August 2017) to the black line (December 29, 2017), and further to the red line (January 26, 2018) – in other words, how the curve has steepened recently from the one-month yield up through the seven-year yield:
The spread between the one-month yield and the five-year yield on Friday was 1.23 percentage points, the widest since March 20, 2017. And the spread between the one-month yield and the seven-year yield was 1.36 percentage points, the widest since May 22, 2017.
As the yield curve is steepening from the one-month yield up through the middle, it’s slowly pushing up the longer end: even the 30-year yield, after having been stuck for months, has started budging in January and is creeping closer to 3%.
But the 10-year yield on Friday (at 2.66%) was just a smidgen above the seven-year yield (2.60%). So it is from the seven-year yield on up where the yield curve is still relatively flat.
This leaves the closely watched spread between the two-year yield and the 10-year yield at 0.53% on Friday, near the lows of 0.50% in mid-December. In much of 2017, there was a lot hand-wringing about the possibility the yield curve could “invert” – that the 10-year yield could fall below the two-year yield – which was what had happened before the Financial Crisis. This phenomenon has been reliably associated with recessions.
For much of 2017, the two-year yield rose while the 10-year fell. Those were scary moments. But that’s not happening anymore. What has happened since mid-December is that the two-year yield has surged, and the 10-year yield has surged at about the same pace.
The suggestion has been made that the yield curve isn’t out of the woods unless it steepens to where the spread between the two-year and the 10-year yield widens back to some sort of post-Financial-Crisis normal, somewhere between 1.5 and 2.5 percentage points.
But wait… If the Fed nudges up its target range four times this year – a number that keeps cropping up – the two-year yield might rise to about 3% by the end of 2018. And if the spread between the two-year and the 10-year yield widens to 2 percentage points at the same time, it would push the 10-year yield to about 5% by year-end.
And wait… Mortgage rates follow the moves in the 10-year yield. On Friday, the average 30-year fixed-rate mortgage for top-tier borrowers rose to 4.28%, about 1.6 percentage points above the 10-year yield. If the Fed raises rates four times in 2018 and if the 2-to-10-year spread widens to 2 percentage points, then the average 30-year fixed-rate mortgage for top-tier borrowers might have a rate of around 6.6% by the end of 2018.
Would the housing market be able to digest these kinds of mortgage rates – with home prices as inflated as they are in many cities – without an abrupt decline in demand followed by a big adjustment in prices?
That was a rhetorical question.
And wait… At the end of 2018, would anyone still buy junk bonds at current yields (the effective yield of the average BB-rated junk bond is 4.38%), when you can buy Treasuries at a yield of 5%?
This too was a rhetorical question.
A flattish yield curve above seven-year maturities might just be what will make those rising shorter-term rates digestible without causing too much upheaval in the housing bubble, the corporate bond market, particularly the junk-bond bubble, and other parts of the economy. Even if spreads remain where they’re today as the Fed hikes rates four times this year, there will be plenty of adjustments in the markets. But if the yield curve steepens rapidly as the Fed hikes rates, it could get complicated, as they say.
What’s going on is a sell-off in the Treasury market. Read… Bond Market’s “Inflation Expectations” Highest since 2014