Source: Clive Maund for Streetwise Reports (4/14/18)
Technical analyst Clive Maund examines stock market charts and discusses what he sees as possible consequences of the Syria strike.
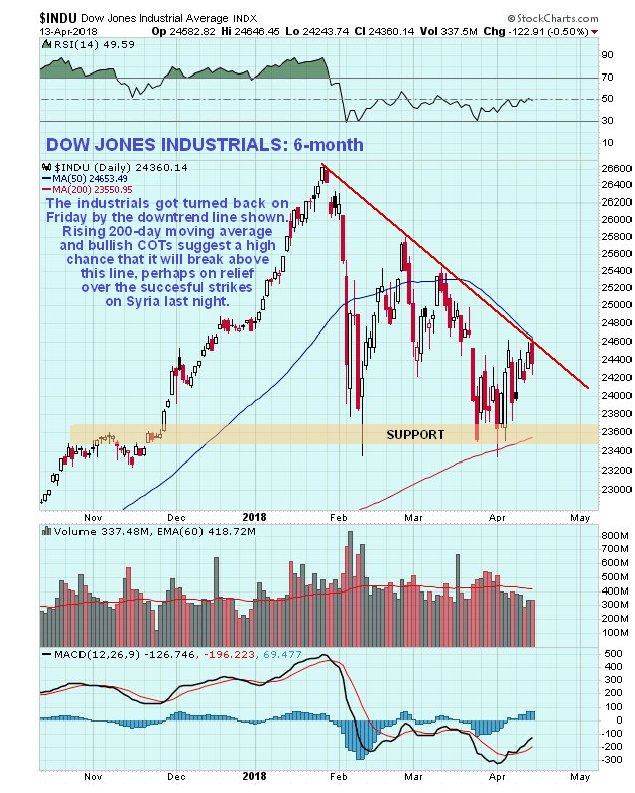
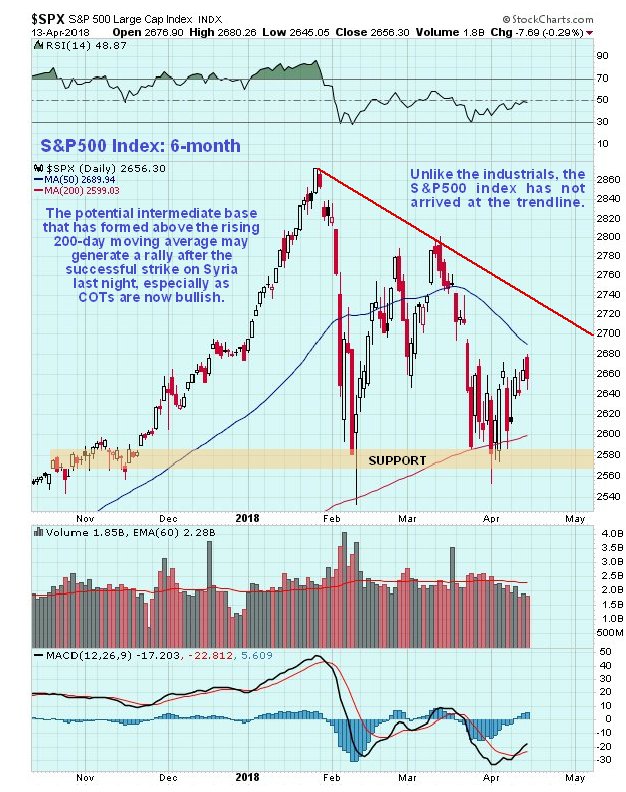
On the 6-month chart for the Dow Jones Industrials, it looks like it is rolling over and set to drop again after arriving at the red downtrend line shown. However, the pattern that has formed over the past few weeks could be an intermediate base that might lead to a significant rally, especially as it has developed just above a still rising 200-day moving average.
The latest Hedgers chart shows that Smart Money is a lot more bullish than Dumb Money, which also makes a rally more likely.
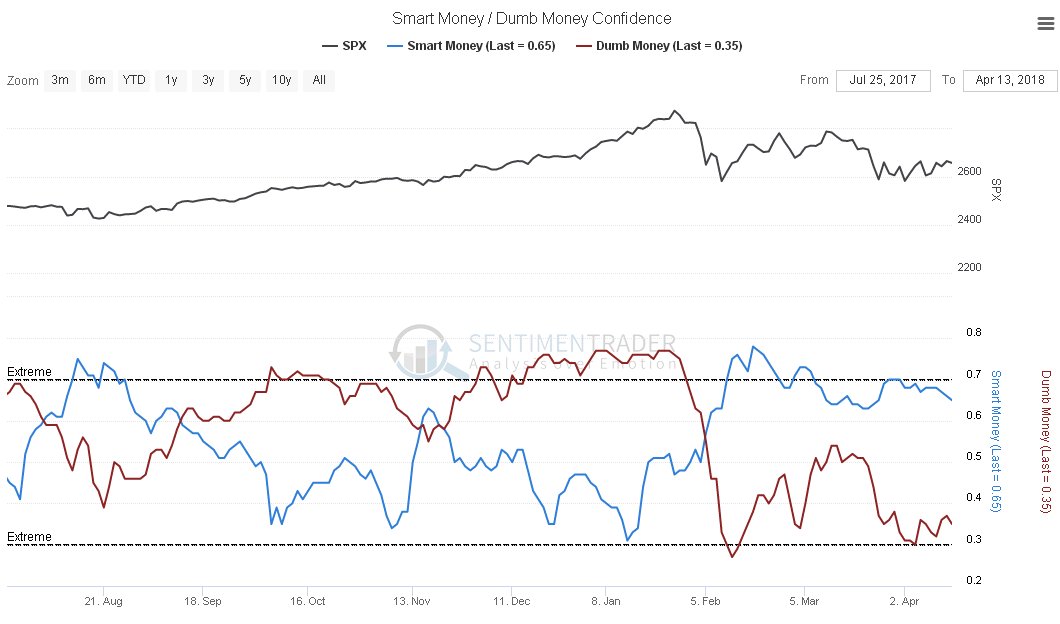
Chart courtesy of sentimentrader.com
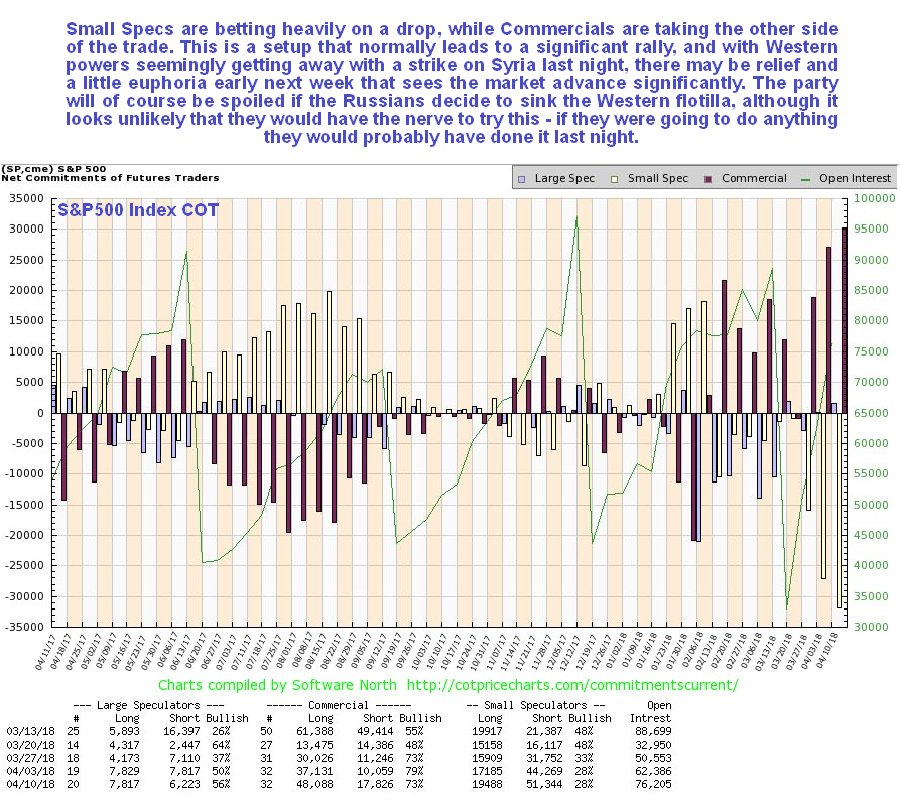
Fundamentally, a reason for a rally next week would be the West seemingly getting away with striking Syria last night, without any immediate adverse consequences. This could lead to a sense of relief and perhaps a little euphoria in the market.
Clive Maund has been president of http://www.clivemaund.com, a successful resource sector website, since its inception in 2003. He has 30 years’ experience in technical analysis and has worked for banks, commodity brokers and stockbrokers in the City of London. He holds a Diploma in Technical Analysis from the UK Society of Technical Analysts.