via upfina:
The biggest story on Friday was that the spread between the 10 year yield and the 3 month yield went negative which means the yield curve inverted. The 10 year yield fell 10 basis points to 2.44% which was its lowest close since December 29th, 2017. It dropped 80 basis points since peaking in November. The yield was slightly late to the party as economic growth had been slowing before November, but now it has swung to the other side and become extremely bearish.
The concept that bonds are the ultimate arbiter of economic truth needs to be thrown out. There is short term momentum driven mispricing in this market just like stocks. Treasury yields are being pushed lower by the decline in global yields as the German 10 year bond yield went negative for the first time since September 2016. There is $10 trillion in negative yielding global debt outstanding. That’s not to say the yield curve inversion won’t be correct in anticipating further economic slowing, and higher risk of a recession. Instead, we encourage you to look at other indicators as well.
Despite the rallying stock market and record high leading conditions index, the decline in yields suggests growth and inflation will fall just like the Merrill Lynch fund managers survey suggested. The Fed’s rate hike in December made the Fed funds rate 2.4%. That’s why the 3 month bill is 2.46%. It is above the 10 year yield because long maturity date yields have fallen with inflation and growth expectations. The table below shows there is a recession in the next 16 months on average after this 10 year 3 month inversion.
Stock Market Returns After A Yield Curve Inversion
Many economists consider the 1998 inversion to be a false alarm because it was far ahead of the 2001 recession, but this chart treats it like the others which were timelier.
Market returns following 3m10y yield curve inversions – CS pic.twitter.com/3DNIRZORHC
— Sam Ro 📈 (@SamRo) March 22, 2019
Many bearish investors who are actively betting against the market in the intermediate term would be blown out of their positions if it took almost 3 years for the next recession to show up (like was the case in ’98). On the other hand, the stock market peaked in March 2000, which was 18 months after the inversion.
The table includes the cycles in the 1960s which is different from others. It’s important to get as much data as you can because even though this research goes back 53 years, there are only 8 data points to work with.
The cumulative average returns aren’t tragic like many bearish investors project as stocks increase 9.2% in the next 24 months after this inversion. The worst sequential period is from 24 to 30 months where they fall 5.7% on average. The bearish investors love to act as if it’s a sure thing that this cycle will end like 2008. When deciding if that’s the case, acknowledge that recessions like that are very rare. Here is an important article we wrote on this topic. The global financial system came close to collapsing. The sharp bear market doesn’t come close to telling the full story of the crisis because it could have been way worse. It’s not impossible for another crisis to occur, but there isn’t about to be another housing crisis again as lending standards have improved.
Will The Fed Cut Rates In 2019?
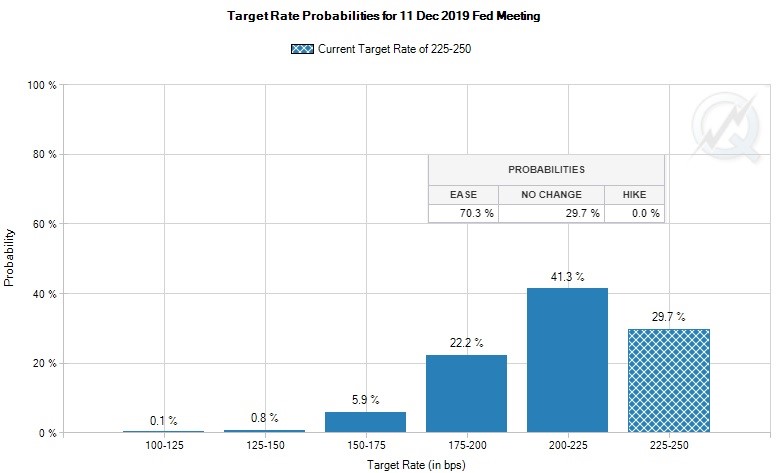
It’s amazing how quickly the Fed went from agreeing with the Fed funds futures market to disagreeing with it. The Fed’s official guidance projected 2 hikes in 2019 up until its March 20th meeting. On the day of the press conference, the Fed funds futures market and the official guidance called for rates to stay in place for the rest of the year. It took just 2 days for that to change. There was just a short moment where the Fed was in tune with the market. This implies the Fed is being pushed into certain policy by the market, however, the Fed’s open mouth policy affects the futures market. Sometimes the dog wags the tail and sometimes the tail wags the dog. As you can see from the chart below, there is a 70.3% chance the Fed will cut rates at least once in 2019. The odds of a cut probably increased on Friday because of the weak Markit reports.
U.S. & German Markit Reports
The American flash March Markit report was very disappointing. We already knew manufacturing was weak, but the larger than expected decline in the services index put a huge damper on this report. The overall PMI fell from 55.5 to 54.3 which was a 6 month low. The services index fell from 56 to 54.8 which was a 2 month low. That’s far from a disaster, but the sector didn’t carry the water for manufacturing which is why the overall reading was weak. The manufacturing PMI and output indexes fell from 53 and 52.7 to 52.5 and 51.6. That was a 21 month low for manufacturing PMI and a 33 month low for output. This overall PMI was weak in rate of change terms, but still projects over 2% Q1 GDP growth which is above the consensus.
The headline maker of the Markit reports was German manufacturing. As you can see from the chart below, manufacturing output and the PMI output index are declining rapidly. They are in contraction territory. Manufacturing and output fell from 47.6 and 47.9 to 44.7 and 45 as both hit a 79 month low. Even though the services index only fell slightly to 54.9 from 55.3, the composite index fell from 52.8 to 51.5 which was a 69 month low.
Flash #PMI for #Germany consistent with Q1 GDP quarterly rise of c.0.2% but headline index now lowest since June 2013. Manufacturing output fell at sharpest rate since August 2012. Factory orders deteriorated to the greatest extent since in April 2009 https://t.co/IQ1ZWuxldn pic.twitter.com/amBMohPEon
— Chris Williamson (@WilliamsonChris) March 22, 2019
ECRI’s Growth Improves
It’s quite something to see the yield curve predicting a recession in 16 months while the ECRI leading index’s yearly growth rate is improving rapidly. As the chart below shows, yearly growth improved from -2.9% to -2.3%. That’s a huge improvement from the 6.8% decline at the start of the year.
ECRI U.S. Weekly Leading Index growth rate edged up to -2.3%. Read more and download ECRI WLI data for free here: https://t.co/66Jk1X0uSv pic.twitter.com/IDW0DXCKtK
— Economic Cycle Research Institute (ECRI) (@businesscycle) March 22, 2019
The results signal a weak Q2 and Q3, but a potential end to the slowdown late in the year or early next year. The February ECRI coincident index’s growth rate fell from 2.4% to 2.2%. That weakness in rate of change terms should continue.
Mortgage Rates To Fall
One of the most important aspects of the bullish housing thesis is that rate declines will spur demand. The chart below shows the spread between the contract and consumer mortgage rate is very high which implies mortgage rates have further to fall.
https://twitter.com/DavidSchawel/status/1109149565251473408
The February existing home sales report signaled low rates might finally be helping housing as sales increased from 4.93 million to 5.51 million which was a 11.8% monthly gain. Expectations were for 5.1 million making this the biggest beat since at least 2005. The yearly growth rate was still weak at -1.8%, but this report is still a positive for the housing market which was very weak in Q4 2018.
Conclusion
The 10 year 3 month yield curve inverted. This increases the likelihood and circumstances for a recession to occur in 2020, but this is far from a reason to short stocks with reckless abandon. You need to do more research before you execute your trades. Bearish investors liked the weak Markit PMIs, but they must be concerned by the improving ECRI yearly growth rate. Interest rates on mortgages should fall which should help the housing market this year.