Wolf Richter wolfstreet.com, http://www.amazon.com/author/wolfrichter
Emerging Markets turmoil: The price of cheap debt & misallocation of capital.
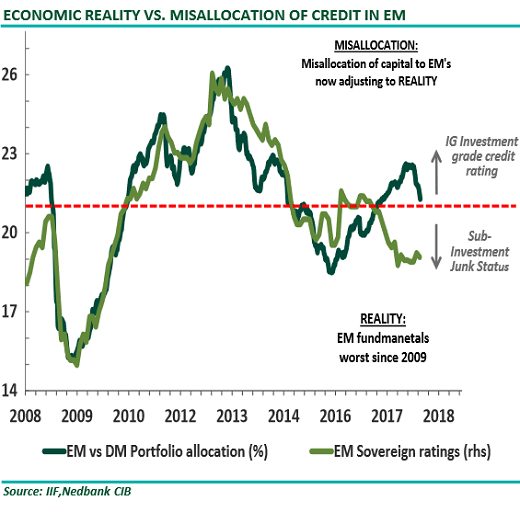
“Excess liquidity usually leads to the misallocation of capital, masking any balance sheet constrains. As this tide of excess liquidity recedes, it reveals the misallocation of capital and the mispricing of risk,” Nedbank CIB strategists Neels Heyneke and Mehul Daya write in a note. And this is particularly the case for excess dollar-liquidity in the Emerging Markets (EMs).
Sovereign credit ratings – such as those issued by Moody’s, Standard & Poor’s, and Fitch – of the emerging market countries have dropped sharply since late 2016. In Aggregate, they’re now solidly into “junk” (below investment grade) and have reached the lowest range since the Financial Crisis. Yet, despite the rising risks, “investors have allocated large amounts of their portfolio allocations to EMs relative to Developed Markets (DMs).”
These investors were induced to do so by:
- Scanty returns in Developed Markets
- Excess central bank liquidity
- The perception that a number of Emerging Markets have made the necessary structural changes to their economies.
“EMs, in particular financial markets, have benefited from this misallocation of credit,” the strategists write. “As the tide of excess liquidity recedes, EMs like South Africa will begin to pay the heavy price of this misallocation of credit.”
In the chart below, the dark green line shows the percentage of portfolio balances allocated to Emerging Markets (dark green) versus Developed Markets. Note how this percentage has surged starting in early 2016 and how it recently has begun to recede – the outflow of the hot money.
The strategists write:
One way to monitor the ebb and flow of excess liquidity is by analyzing the changes in the value of the USD. As long as the dollar remains the reserve currency and most of the foreign owned debt is denominated in US dollars, for example in the carry trade, the dollar will remain king.
A weaker dollar and a supply of low-cost dollar-debt is associated with a stable global environment. And a stronger dollar, they note, “is usually associated with volatility and a risk-off phase as liquidity contracts.”
Since the beginning of 2018, borrowed dollars have gotten more expensive in the EMs – and hence “scarce” – as investors that were chasing yield in the EMs are suddenly having second thoughts about the risks associated with these adventures.
In addition, trade tensions between the US and the EMs have added to those risks for EM investors. Credit growth in China has slowed. And some commodity prices, which are crucial to some EMs, have declined.
In addition, the Fed is accelerating its QE Unwind, which has the effect that the market now has to absorb the Treasury securities that the Treasury Department is issuing, and the Treasury Department is issuing ever larger piles of them. With US yields being higher – and more attractive – they’re drawing liquidity from riskier EMs.
In addition, other central banks are backpedaling on QE. The ECB, which already tapered its QE program to €30 billion a month, will taper it to zero by the end of the year. And the Bank of Japan has changed its approach as well.
“Except for an expected short-term reprieve, we expect these tighter USD conditions to remain in place for the rest of the year,” the strategists write. “That is unless policy makers react soon to stimulate financial markets with liquidity.”
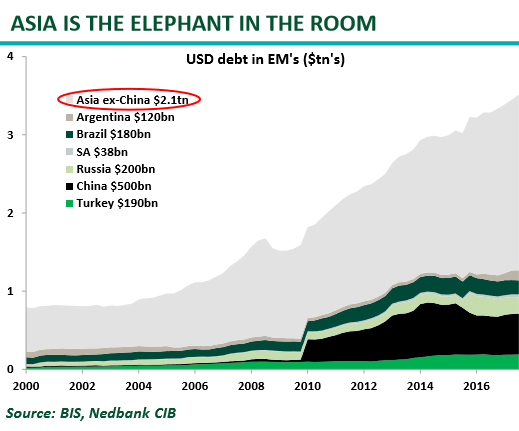
“Asia is the elephant in the room.”
“Southeast Asia stands out again as in 1997/8, with a large amount of USD denominated debt outstanding,” the write. “The only difference is then Asia had fixed exchange rates and now they are floating! We believe Asia will be the next source of downside systemic risk for financial markets.”
The chart below shows dollar-denominated debt in the EMs, in trillion dollars. This does not include euro-denominated debt which plays a large role in Turkey. The fat gray area represents Asia without China:
Asia’s dollar-denominated debt, relative to its foreign exchange reserves and exports, has risen significantly since 2009, they note. The chart below shows the ratio between dollar-denominated debt and foreign exchange reserves in Asia, with China (green line) and without China (black dotted line). Values over 50% mean that there is more dollar-debt than foreign exchange reserves:
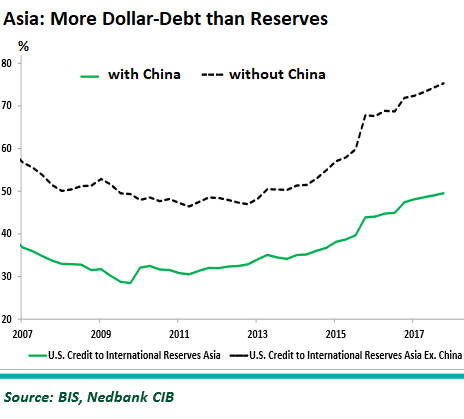
“This leaves these nations susceptible to a shortage in USDs,” they write:
Notably, the Asian nations that have amassed record amounts of USD debt are also home to the largest technology companies i.e. Tencent (China), Alibaba (China), TSNC (Taiwan), Samsung (South Korea). The tech sector is now 28% of the MSCI EM index.
The rally in the US Dollar, dented global growth prospects, credit growth in China slowing down and escalating political tensions from the US leaves these nations very exposed to a shortage in USDs.
It is very evident on this chart (below) that the changing financial conditions have been the major driver of EM and SA asset prices over the last several years. The risk-on phase ended in January and all EM assets sold-off. EM-FX are however now taking the lead and the next few days will indicate whether this will spill over into the other asset classes.
The chart below depicts four EM asset classes through 8/10/18.
- Green line, MSCI EM equities (1st right axis);
- Orange line, BBG EM Forex index (2nd right axis);
- Black line, GS Financial Conditions Index (1st left axis);
- Gray line, SA Top40 (2nd left axis).
Note the orange line, representing Forex moves:

The strategists conclude: “A number of studies have emerged pointing out that the role of global factors has increased relative to country/corporate specific factors. This indicates that investors need to place more emphasis on the role of global liquidity (changing pool money and credit).”
A vicious cycle, kicked off by cheap debt that’s suddenly not cheap, after 8 years of experimental monetary policies. Read... Rise of US Dollar Haunts Emerging Market Debt