
By Wolf Richter for WOLF STREET.
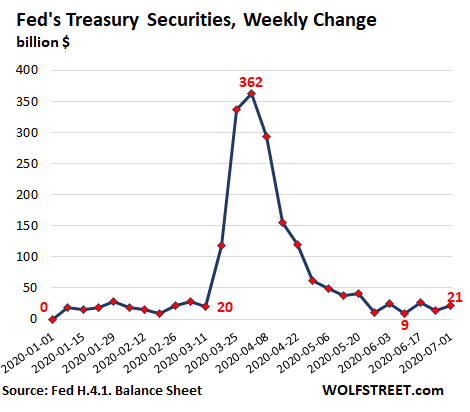
The Fed added some assets and shed other assets, and the net effect on the balance sheet for the week ended July 1, released Thursday afternoon, was that total assets dropped by $76 billion, after having dropped by $12 billion a week ago, and by $74 billion two weeks ago. That three-week drop of $163 billion was far faster than any three-week decline during the official QE unwind from late 2017 into 2019:
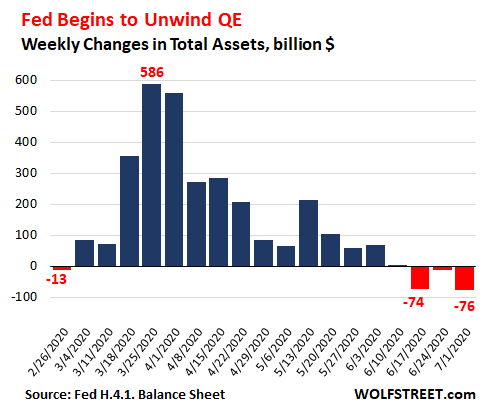
The chart above shows how the Fed front-loaded QE when the crisis erupted, throwing $1.5 trillion at it in the first four weeks, when financial markets came unglued and when credit was freezing up, and when investors in overleveraged hedge funds, mortgage-REITs, and other risk-takers were about to learn a lesson about capitalism – which the Fed’s bailout made sure they didn’t have to learn.
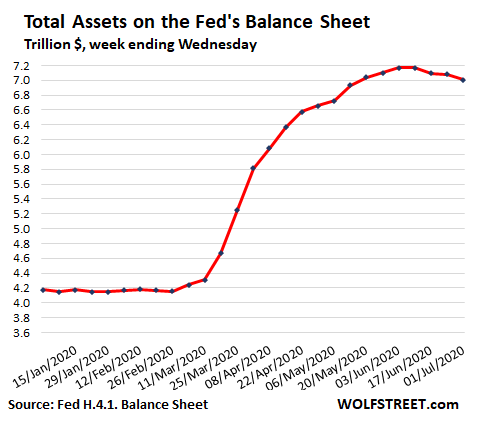
The $163-billion decline in total assets over the past three weeks brought the Fed’s assets down to a still mind-blowing $7.01 trillion.
The curve in the chart below shows the sudden ramp-up, the fairly quick taper, and then, over the past three weeks the drop. This was planned from the beginning: Give it all up-front but don’t let it drag out for years as last time:
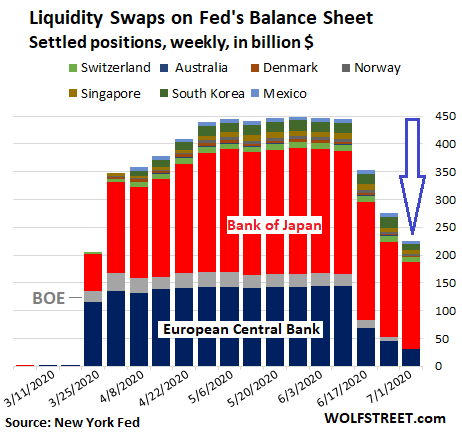
Central-bank liquidity-swaps dropped by $50 billion.
The Fed’s “dollar liquidity swap lines” with other central banks fell by $50 billion in the week ended July 1 to $225 billion, the third week in a row of declines. They have now dropped by half over those three weeks.
To enter into a swap, the Fed lends newly created dollars to another central bank and takes their newly created domestic currency as collateral. The swap lines drop when swaps mature and the Fed gets its dollars back. The fact that maturing swap aren’t rolled over into new swaps shows that other central banks don’t need the dollars any longer:
Fed Alphabet-Soup of SPVs edged up by $3 billion, from Sept. 18 low.
The Fed has by now created 10 of these Special Purpose Vehicles (SPVs), that, as it says, are authorized under Section 13 paragraph 3 of the Federal Reserve Act, as amended by the Dodd-Frank Act, which is why Jerome Powell calls them “thirteen-three facilities.” Nine of these 10 SPVs were active on the current balance sheet:
- PMCCF: Primary Market Corporate Credit Facility
- SMCCF: Secondary Credit (not active yet)
- PDCF: Primary Dealer Credit Facility
- MMLF: Money Market Mutual Fund Liquidity Facility
- PPPLF: Paycheck Protection Program Liquidity Facility
- CPFF: Commercial Paper Funding Facility
- CCF: Corporate Credit Facility
- MSLP: Main Street Lending Program
- MLF: Municipal Liquidity Facility
- TALF:Term Asset-Backed Securities Loan Facility
The Treasury Department puts equity capital – taxpayer money – into each of these SPVs as loss protection for the Fed. The Fed lends to the SPV at a leverage ratio of 10 to 1. The SPV then buys securities.
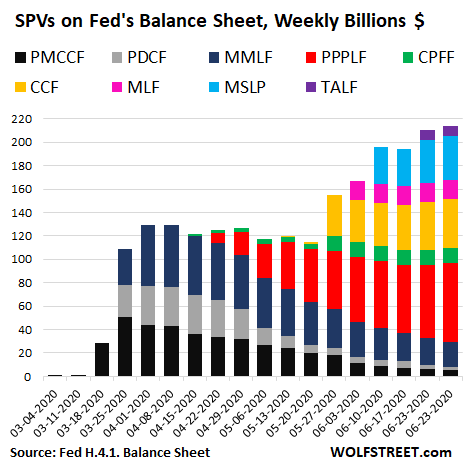
All those SPVs combined now carry a balance of $214 billion, up $3 billion from a week ago. The largest are:
- PPPLF (red column in the chart below), which buys PPP loans from banks. It grew by $6 billion last week to $68 billion, accounting for 32% of the total alphabet soup.
- CCF (yellow) rose a smidgen to $42 billion, accounting for 20% of the alphabet soup. This SPV buys corporate bonds, bond ETFs, and corporate loans.
- MSLP (baby-blue) remained flat at 37.5 billion, accounting for 18% of the total. This SPV buys loans from banks that banks have extended to small and medium-size businesses.
- MMLF (dark-blue), the money-market bailout SPV, has declined from $53 billion in early April to $21 billion now, accounting for 10% of the total.
The big three SPVs in March are fading away. But new SPVs have sprung up. The latest creation is the resurrection of TALF two weeks ago (top purple). It has stayed flat at $8.8 billion. This SPV lends to investors against asset backed securities, such as subprime credit card ABS and other structured assets on a non-recourse basis. If this bet blows up, investors wash their hands off it, and the SPV eats the debris.
But the astounding thing about all these 10 SPVs is this: After three months of ceaseless hype in the media about the hundreds of billions of dollars each would purchase, amounting to trillions of dollars in total, those SPVs now only hold $214 billion in assets combined. They just haven’t bought much:
Treasury securities rise by $21 billion
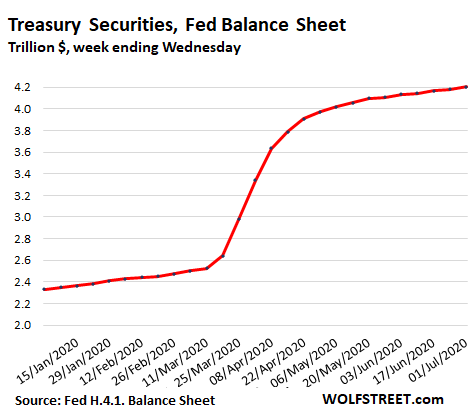
The balance of Treasury securities rose by $21 billion during the week, to $4.2 trillion. Over the past six weeks, the balance increased in the same range between $9 billion and $26 billion a week. Note the front-loading of QE:
The curve of the total amount of Treasuries on the Fed’s balance sheet has gone from crazy-steep in March and April back to the same slope that it had in January and February before the Everything-Bubble bailout mania:
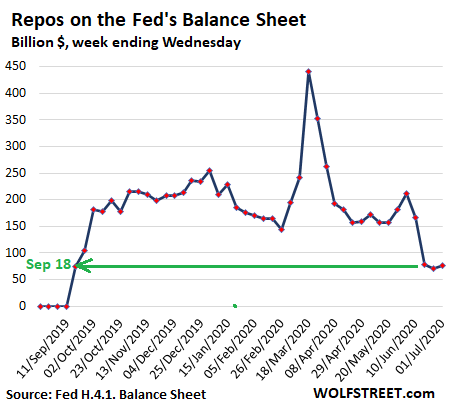
Repo balances ticked up $5 billion, still at Sep 18 Low.
The Fed is offering theoretically huge amounts of repurchase agreements every day, but it has made its offering terms less attractive, and now there’s little appetite for them. What’s left on the balance sheet are mostly older term repos that disappear when they mature. And few are getting rolled over. The total repo balance ticked up by $5 billion to $75 billion, after having dropped by $8 billion last week, and by $88 billion the week before:
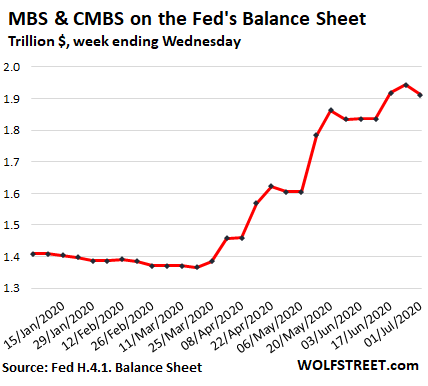
MBS dropped by $32 billion.
Mortgage-backed securities – by their nature – are an erratic element on the Fed’s balance sheet for two reasons.
One, holders receive pass-through principal payments as the underlying mortgages are paid down or are paid off. The current boom in refis due to record low interest rates has created a torrent of pass-through principal payments that reduce the Fed’s balance of MBS, and the Fed would have to regularly buy a big chunk of MBS just to keep the balance level flat.
Two, MBS trades take a month or two to settle. For example, the MBS the Fed bought at the end of June will settle in July and August. And the Fed books MBS trades after they settle.
On this week’s balance sheet, MBS fell by $32 billion, to $1.91 trillion, not because the Fed sold MBS – it doesn’t sell them – but mostly because of the pass-through principal payments, which gives you a feel for how big they are from the $1.91-trillion portfolio.
The Fed continues to buy MBS to replace the pass-through principal payments, but the settlement dates a month or two away never match the pass-through principal payments. So you get this erratic chart below. The Fed’s huge MBS buying binge in March didn’t show up on its balance sheet until April and dragged into late May, by which time the Fed had already drastically slashed its MBS purchases. The purchases now showing up reflect trades of a month or two ago:
I didn’t expect the Fed to start unwinding its balance sheet this soon. When I first started pointing out on April 9 that the Fed was drastically cutting its massive QE binge, and as I kept pointing out this trend, I expected the Fed to bring the growth of its assets to zero, as it had done in January and February this year, after the repo market bailout – in other words, that it would only buy enough to replace maturing securities and pass-through principal payments, with no net-change in the balance of its assets.
But now, we see this QE unwind: $163 billion in three weeks is far faster than anything in the period of the official QE unwind that started in late 2017 and lasted into 2019.
And we see a shift – much of the new activity is geared toward propping up consumption by businesses and governments – the PPP facility, the municipal liquidity facility, the main-street lending facility, etc. – rather than propping up asset prices.