
Why would the IMF use the phrase “a second Great Depression” in a report that they know the entire world will read? To be more precise, the IMF stated that “large challenges loom for the global economy to prevent a second Great Depression”. Are they saying that if we do not change our ways that we are going to be heading into a horrific economic depression? Because if that is what they are trying to communicate, they would be exactly correct. At this moment, global debt levels are higher than they have ever been before in all of human history, and in their report the IMF specifically identified “global debt levels” as one of the key problems that could lead to “another financial meltdown”…
The world economy is at risk of another financial meltdown, following the failure of governments and regulators to push through all the reforms needed to protect the system from reckless behaviour, the International Monetary Fund has warned.
With global debt levels well above those at the time of the last crash in 2008, the risk remains that unregulated parts of the financial system could trigger a global panic, the Washington-based lender of last resort said.
And the IMF report also seemed to indicate that global central banks were responsible for the situation in which we now find ourselves.
In the report, an “extended period of ultralow interest rates” was blamed for “the build-up of financial vulnerabilities”…
The IMF Global Financial Stability report read: “The extended period of ultralow interest rates in advanced economies has contributed to the build-up of financial vulnerabilities.
“The large accumulation of public debt and the erosion of fiscal buffers in many economies following the crisis point to the urgency of rebuilding those defences to prepare for the next downturn.”
This is extremely unusual language for a globalist institution such as the IMF to be using.
Are they trying to signal that a major global financial crisis is imminent?
Of course they would hardly be the first to sound the alarm. Prominent names throughout the financial world are making all sorts of ominous declarations these days, and more red flags continue to pop up with each passing day.
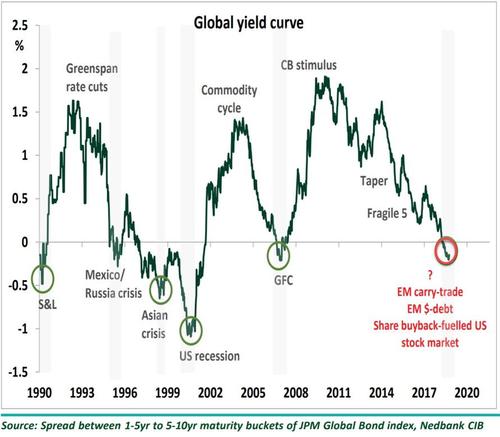
For example, according to one analysis the global yield curve has gone negative for the first time since the last financial crisis, and this has created “the perfect cocktail”for a “liquidity crunch”…
A stronger US dollar and the global cost of capital rising is the perfect cocktail, in our opinion, for a liquidity crunch.
Major liquidity crunches often occur when yield curves around the world flatten or invert. Currently, the global yield curve is inverted; this is an ominous sign for the global economy and financial markets, especially overvalued stocks markets like the US.
To me, that is one of the most alarming charts that we have seen in a very long time.
Everything in the global financial system revolves around the flow of debt. When money is cheap and flowing freely, economic growth tends to expand. But when a liquidity crunch happens, economic activity can start contracting very rapidly, and it looks like that is the type of scenario that is quickly starting to develop.
In fact, we are already witnessing a substantial liquidity crunch in emerging markets. Lenders are hesitant to lend while economic conditions in those countries are chaotic, and a rapidly rising dollar has made servicing existing dollar-denominated debts increasingly problematic.
As we witnessed in 2008, debt bubbles end when liquidity begins to tighten up. The only way that this current debt bubble can survive is if it continues to expand, and it can only expand for as long as lenders are willing to part with their money easily.
If interest rates continue to go higher, the U.S. economy and the global economy as a whole are going to be hit really hard.
On Thursday, the fact that interest rates “hit new multiyear highs” was blamed for the large decline in the stock market…
Stocks fell sharply on Thursday as interest rates hit new multiyear highs, dampening investor sentiment.
The Dow Jones Industrial Average dropped 201 points as Nike and Home Depot lagged. The 30-stock index dropped 356 points at its lows of the day and posted its worst decline since Aug. 10.
The Dow hit a new all-time high earlier this week, but many believe that it was essentially an illusion.
Because right now there are three times as many stocks at 52-week lows than there are stocks at 52-week highs. Prior to this week, there was only one other day since 1965 when this happened…
There have been two days since 1965 have seen 3x as many NYSE stocks at year-lows than at year-highs while the Dow traded at an all-time high.
The only other time prior to October 3, 2018?
December 28, 1999. The Dow was just days prior to hitting 11,722 on January 10, 2000, which would mark its long-term top. It would bottom at 8,062 on September 21, 2001. A 32% decline. The Nasdaq lost over 60% of its value during that same period, and would decline 78% from its all-time high.
I know that I have used a lot of technical jargon in this article, but the bottom line is this…
Big trouble is coming.
At this point, even Dennis Gartman is saying that “one cannot but think that a global bear market of some very real consequence is developing.”
Sentiment on Wall Street has shifted at a rate that is absolutely breathtaking. The mindless optimism of recent years has been replaced with an ominous feeling that a major downturn is imminent.
And because markets tend to go down a lot faster than they go up, a lot of people could end up being wiped out financially before they even realize what just hit them.