Skip to content

Investment Watch Blog

  • Home
  • About
  • Newsletters/RSS
  • Disclaimer

chart

The SP500 chart from the crash in 2008 is a direct replica of todays chart…

March 1, 2022 9:15 pm
Categories Latest Story

This Chart Proves Economic Collapse Is Near (Analyst)

January 19, 2022 2:05 pm
Categories Latest Story

This chart highlights that the transition from conventional power generation to green power is anything but smooth. Above all, it is becoming more expensive!

December 31, 2021 1:46 pm
Categories Latest Story

Charles Hugh Smith: One Chart Traders Might Want to Ponder

December 18, 2021 11:59 pm
Categories Latest Story

Overnight Reverse Repurchase Agreement Chart: This is normal right?

November 18, 2021 10:26 am
Categories Latest Story

Popular Investors Alignment Chart

November 12, 2021 3:55 pm
Categories Latest Story

Where The Fed Sits In One Chart (Taylor Rule Hints At Target Rate Being 8.80% Instead Of 0.25%)

November 7, 2021 8:17 pm
Categories Latest Story

This Chart Will Blow Your Mind

November 4, 2021 7:28 amNovember 2, 2021 6:56 pm
Categories Featured Post

This chart is just nuts. Have to believe 75% of the massive NDX options volume is $TSLA. Just a casino

October 31, 2021 10:07 am
Categories Latest Story

Take a look at this chart of tesla since 2020 to now…. absolutely insanity… never seen such a bubble before in my opinion.

October 25, 2021 10:31 pm
Categories Featured Post

TikTok Hits Creator of Chart Topping “Let’s Go, Brandon!” Viral Music Video With Copyright Strike and Deletion for Own Video

October 22, 2021 2:16 pm
Categories Featured Post

Undervalued Miner Chart – UPDATED [CIFR, HUT, MARA, RIOT, and others]

October 20, 2021 3:38 pm
Categories Latest Story

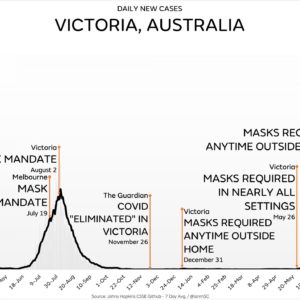
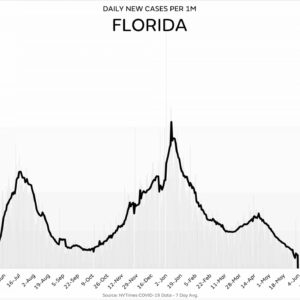
Covid is running rampant in ‘Free Victoria’… Check the chart… Dan Andrews megalomania gets worse…

October 13, 2021 8:52 am
Categories Latest Story

Florida cases drop dramatically WITHOUT mandates… Check the chart…

October 12, 2021 10:35 am
Categories Latest Story

Chart | Wall Street vs Main Street: Why the Stock Market is Not the Economy

October 7, 2021 4:49 pm
Categories Featured Post

Today’s Chart: This Gold Bull Market Has Years To Run

October 4, 2021 2:13 pm
Categories Latest Story

BoA: Energy crisis in one chart: European households will see energy bills rise by 15-30% in both ’21 and ’22…

October 4, 2021 8:45 am
Categories Latest Story

“A very common chart back in the day, looks vaguely familiar…”

September 26, 2021 11:56 am
Categories Latest Story

Today’s Chart: Gold Breakout Coming?

September 23, 2021 3:29 pm
Categories Latest Story

This Simple Chart Reveals the Distribution Of Global Wealth

September 21, 2021 1:21 pm
Categories Latest Story
Older posts
Newer posts
← Previous Page1 Page2 Page3 Page4 … Page10 Next →
  • RSS Feed
  • Twitter
  • Facebook
  • Mail

To afford free speech, IWB needs to be fully reader-funded. Please donate here

Submit Correction/News Tips/Suggestions

Privacy & Cookies: This site uses cookies. By continuing to use this website, you agree to their use. To find out more, see here: Cookie Policy Do Not Sell My Personal Information Please consider turning off your ad blocker to support our website and ensure we can continue to provide quality content for free. Disclaimer

InvestmentWatchBlog.com © 2013-2023. All Rights Reserved.

© 2025 Investment Watch Blog • Built with GeneratePress