In One Chart: Two Decades of Stock Ownership in America
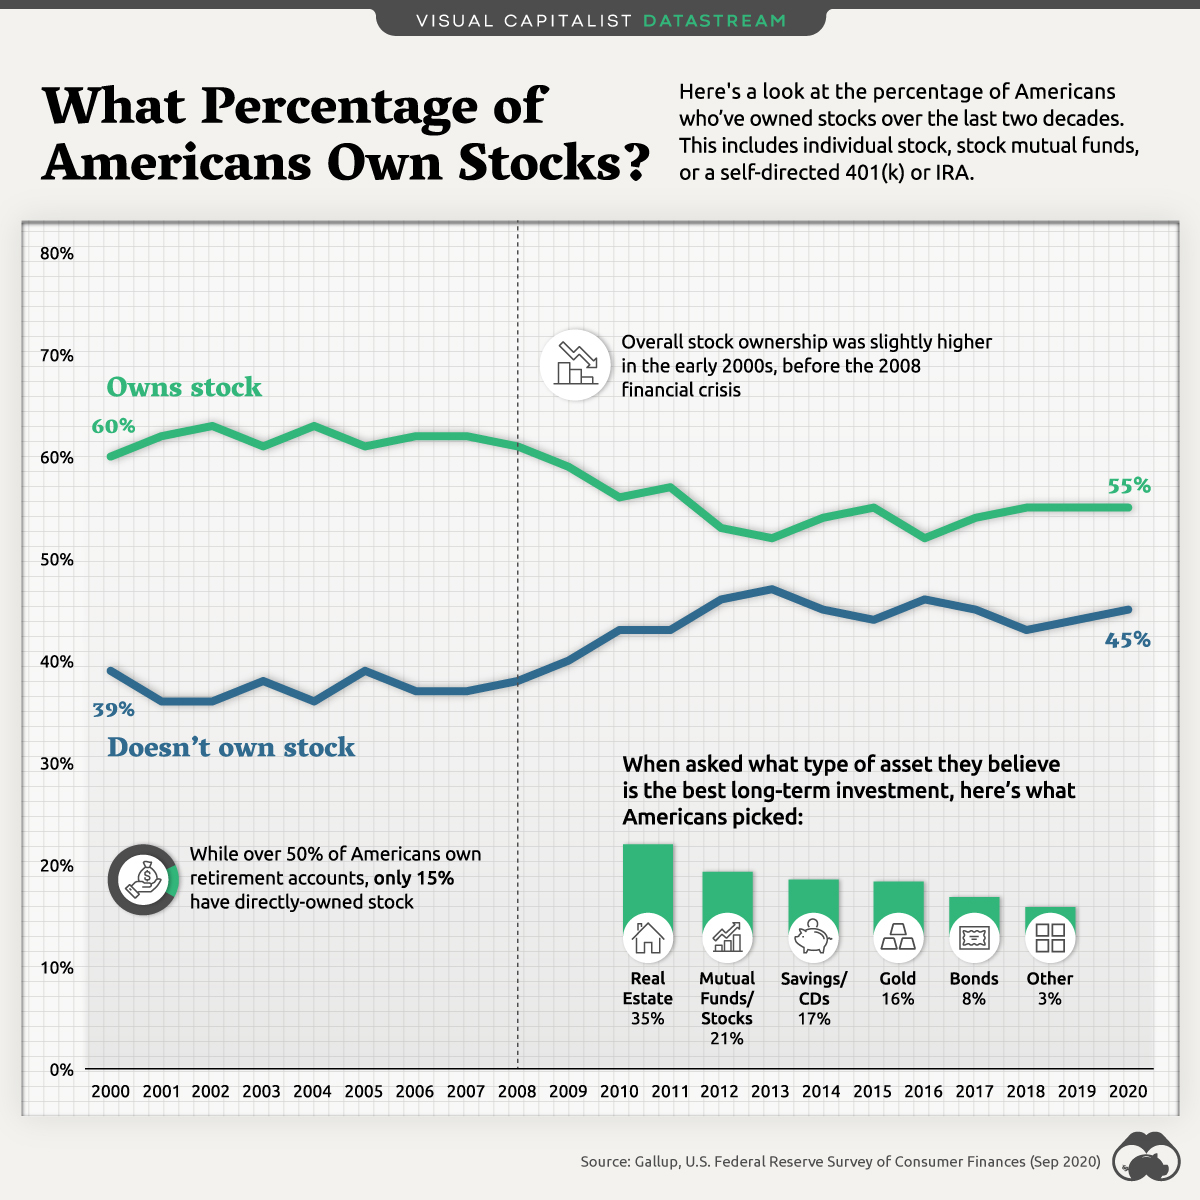
by visualcapitalist How Many Americans Own Stocks? 2020 was an exceptionally volatile year for the stock market. But how many Americans were directly impacted by last year’s market highs and lows? In other words, how many Americans own stocks as a …