Tesla have been charging higher since the lows of last May, as it has rallied from $200 a share to nearly $800! Is it about to run out of juice?
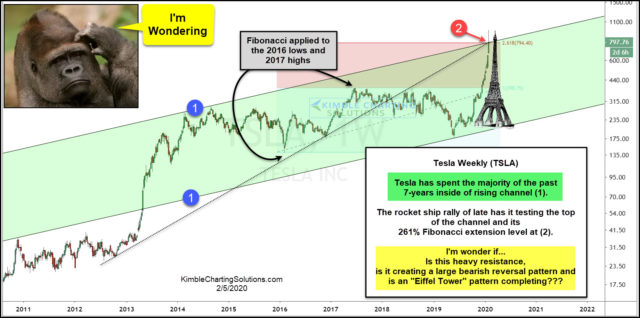
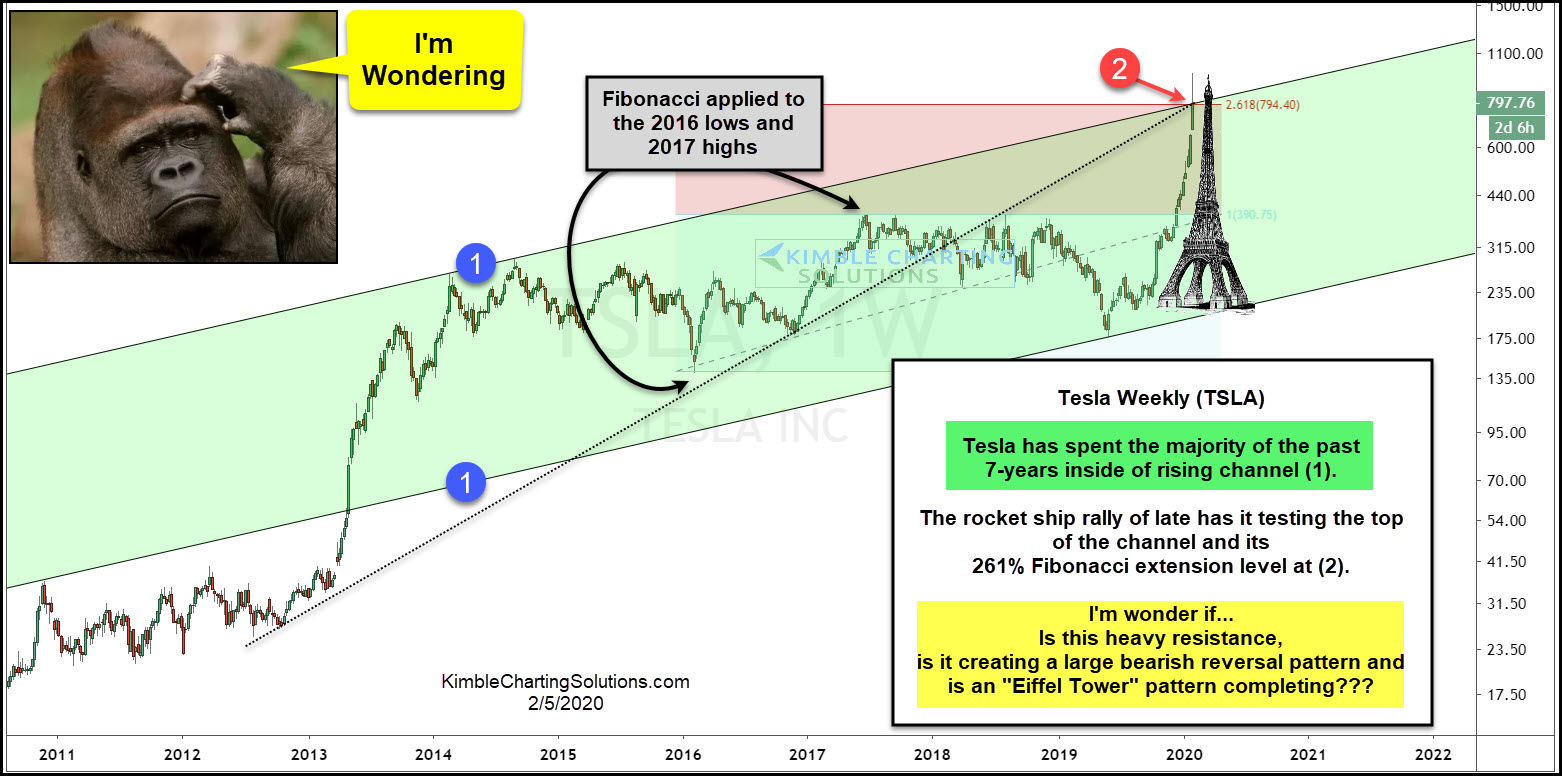
This chart looks at Tesla (TSLA) over the past 9-years. It has spent the majority of the past 7-years, inside of bullish rising channel (1). It touched the bottom of the channel last May, where the powerful rally got started.
The rally off the May low has TSLA testing the top of the rising channel, as its Fibonacci 261% extension level of the 2016 lows and 2017 highs at (2).
While testing the underside of the channel and the 261% extension level, TSLA could be creating a very large weekly bearish reversal pattern, near mid-week.
I’m wondering this morning if; This is an 800-pound resistance test? Will the bearish reversal pattern still be in play at weeks end? Is TSLA completing an “Eiffel Tower” topping pattern at these resistance levels?
Where TSLA finishes the week should go a long way towards giving us a clue to these answers!