by SpontaneousDisorder
The market has drawn these out. I think the combination of rallying to meet these lines with the tremendously overbought technical condition of the stock market makes this important.
This chart shows parallel trendlines for the middle portion of this bull (wave 3) although wave 5 (within this wave 3) didn’t manage to hit the upper line again.
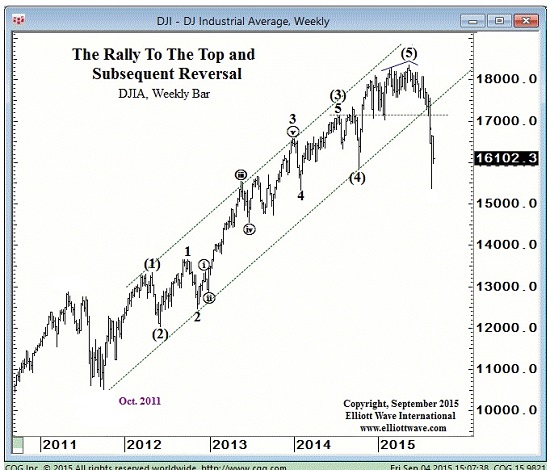
http://www.marketoracle.co.uk/images/2015/Oct/9_15_15dow2.jpg
S&P trendline touch

https://t.co/48S3CnEWhR pic.twitter.com/I8TtZjFvHK
— xTrends (@xtrends) December 1, 2017