Every month, and quarter, economists, analysts, the media, and investors pour over a variety of mainstream economic indicators from GDP, to employment, to inflation to determine what the markets are likely to do next.
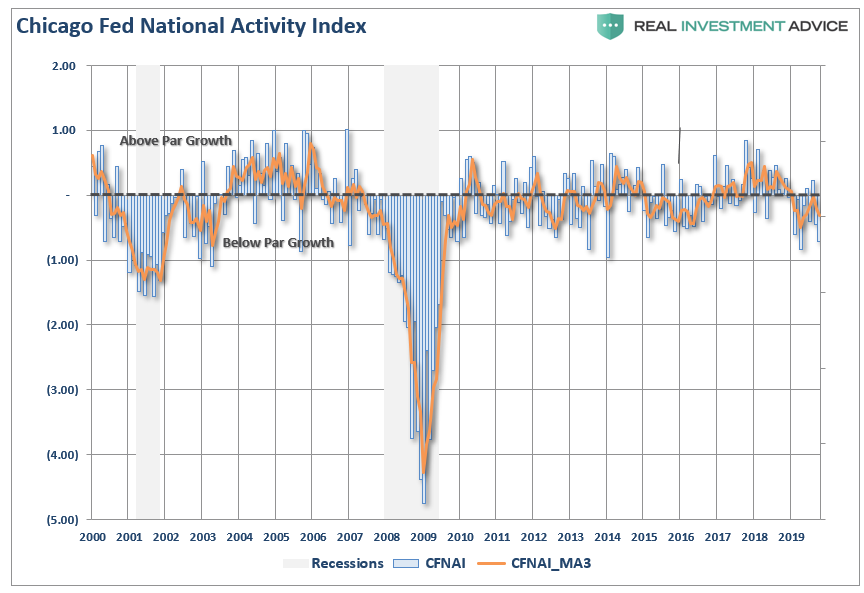
While economic numbers like GDP, or the monthly non-farm payroll report, typically garner the headlines, the most useful statistic, in my opinion, is the Chicago Fed National Activity Index (CFNAI). It often goes ignored by investors and the press, but the CFNAI is a composite index made up of 85 sub-components, which gives a broad overview of overall economic activity in the U.S.
The markets have run up sharply over the last couple of months due to the Federal Reserve once again intervening into the markets. However, the hopes are that U.S. economic growth is going to accelerate going into 2020, which should translate into a resurgence of corporate earnings. However, if recent CFNAI readings are any indication, investors may want to alter their growth assumptions heading into next year.
While most economic data points are backward-looking statistics, like GDP, the CFNAI is a forward-looking metric that gives some indication of how the economy is likely to look in the coming months.

Importantly, understanding the message that the index is designed to deliver is critical. From the Chicago Fed website:
“The Chicago Fed National Activity Index (CFNAI) is a monthly index designed to gauge overall economic activity and related inflationary pressure. A zero value for the index indicates that the national economy is expanding at its historical trend rate of growth; negative values indicate below-average growth; and positive values indicate above-average growth.“
The overall index is broken down into four major sub-categories which cover:
- Production & Income
- Employment, Unemployment & Hours
- Personal Consumption & Housing
- Sales, Orders & Inventories
To get a better grasp of these four major sub-components, and their predictive capability, I have constructed a 4-panel chart showing each of the four CFNAI sub-components compared to the four most common economic reports of Industrial Production, Employment, Housing Starts and Personal Consumption Expenditures. To provide a more comparative base to the construction of the CFNAI, I have used an annual percentage change for these four components.
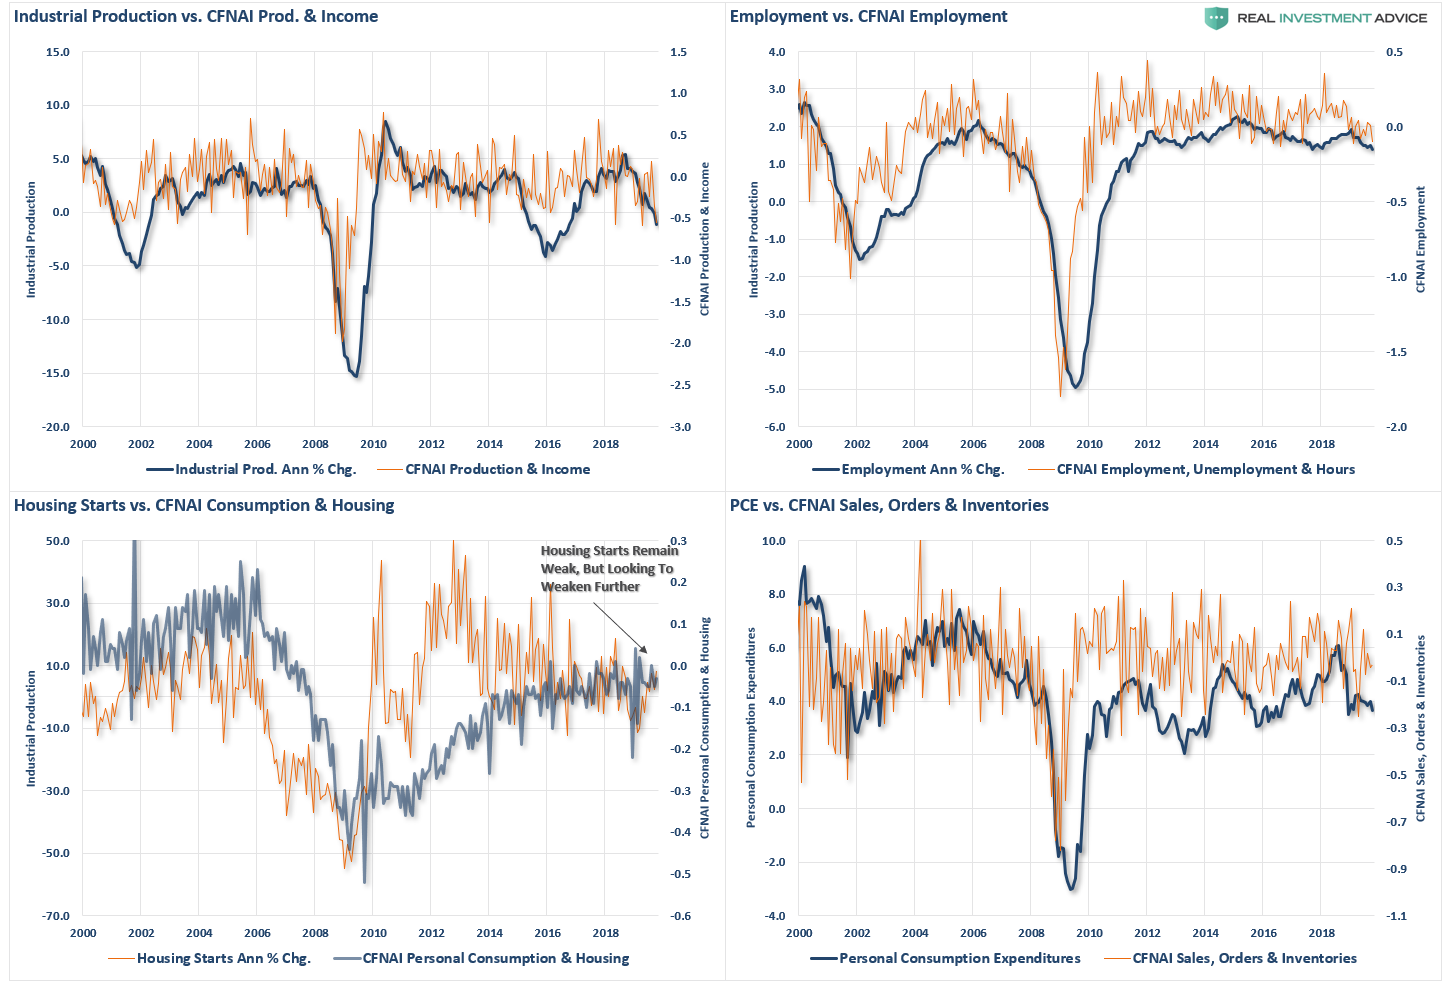
The correlation between the CFNAI sub-components and the underlying major economic reports do show some very high correlations. This is why, even though this indicator gets very little attention, it is very representative of the broader economy. Currently, the CFNAI is not confirming the mainstream view of an “economic soft patch” that will give way to a stronger recovery by next year.
The CFNAI is also a component of our RIA Economic Output Composite Index (EOCI). The EOCI is even a broader composition of data points including Federal Reserve regional activity indices, the Chicago PMI, ISM, National Federation of Independent Business Surveys, and the Leading Economic Index. Currently, the EOCI further confirms that “hopes” of an immediate rebound in economic activity is unlikely. To wit:
“The problem is there is not a ‘major shift’ coming for the economy, at least not yet, as shown by the readings from our Economic Output Composite Index (EOCI).”
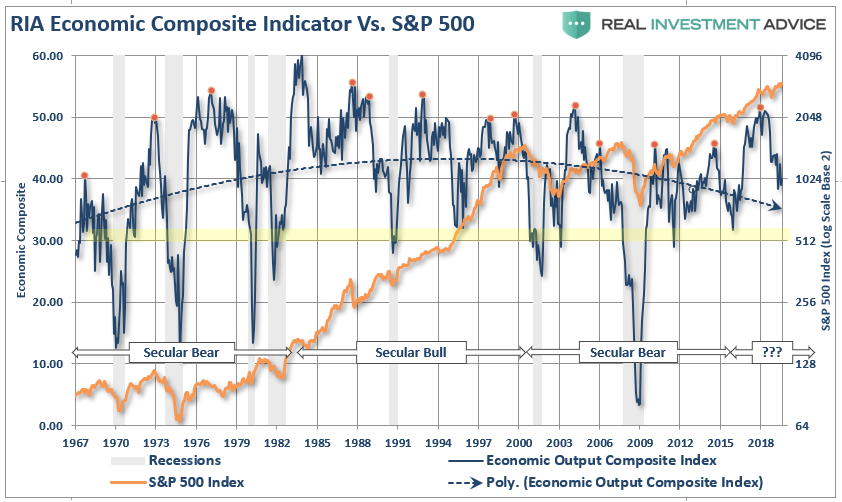
“There are a couple of important points to note in this very long-term chart.
- Economic contractions tend to reverse fairly frequently from high peaks and those contractions tend to revert towards the 30-reading on the chart. Recessions are always present with sustained readings below the 30-level.
- The financial markets generally correct in price as weaker economic data weighs on market outlooks.
Currently, the EOCI index suggests there is more contraction to come in the coming months, which will likely weigh on asset prices as earnings estimates and outlooks are ratcheted down heading into 2020.”
It’s In The Diffusion
The Chicago Fed also provides a breakdown of the change in the underlying 85-components in a “diffusion” index. As opposed to just the index itself, the “diffusion” of the components give us a better understanding of the broader changes inside the index itself.

There two important points of consideration:
- When the diffusion index dips below zero have coincided with weak economic growth and outright recessions.
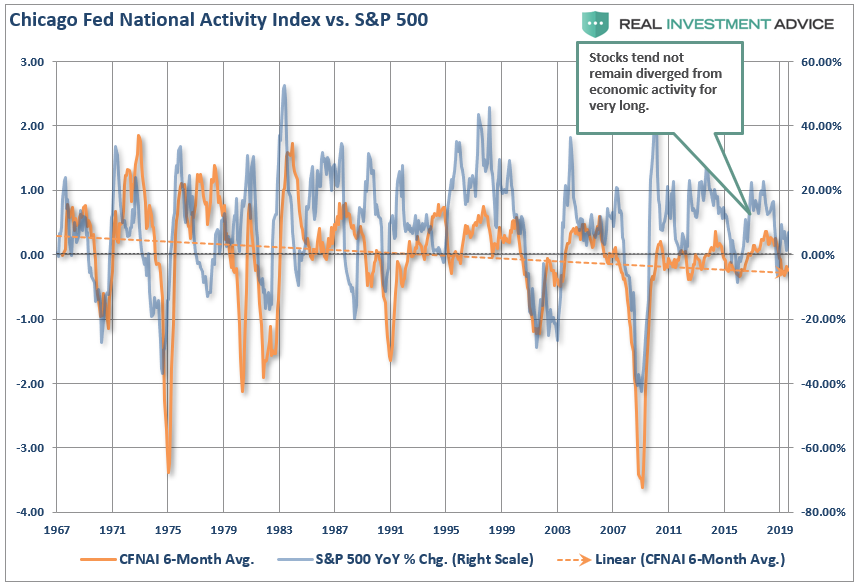
- The S&P 500 has a history of corrections, and outright bear markets, which correspond with negative reading in the diffusion index.
The second point should not be surprising since the stock market is ultimately a reflection of economic growth. The chart below simply compares the annual rate of change in the S&P 500 and the CFNAI index. Again, the correlation should not be surprising.
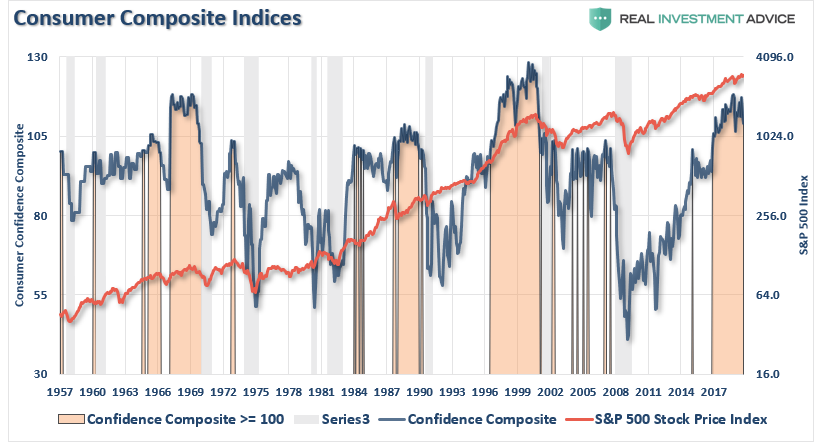
Investors should also be concerned about the high level of consumer confidence readings. There have been numerous headlines touting the “strength of consumer” as support for the ongoing “bull market.”
Overly Confident In Confidence
As we discussed just recently.
“The chart below shows our composite confidence index, which combines both the University of Michigan and Conference Board measures. The chart compares the composite index to the S&P 500 index with the shaded areas representing when the composite index was above a reading of 100.
On the surface, this is bullish for investors. High levels of consumer confidence (above 100) have correlated with positive returns from the S&P 500.”
The issue is the divergence between “consumer” confidence and that of “CEO’s.”
“Is it the consumer cranking out work hours, raising a family, and trying to make ends meet? Or the CEO of a company who is watching sales, prices, managing inventory, dealing with collections, paying bills, and managing changes to the economic landscape on a daily basis?”
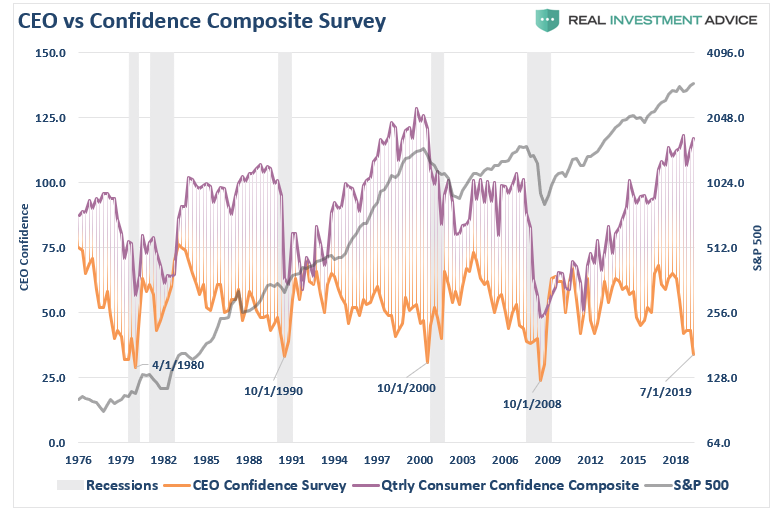
Notice that CEO confidence leads consumer confidence by a wide margin. This lures bullish investors, and the media, into believing that CEO’s really don’t know what they are doing. Unfortunately, consumer confidence tends to crash as it catches up with what CEO’s were already telling them.
What were CEO’s telling consumers that crushed their confidence?
“I’m sorry, we think you are really great, but I have to let you go.”
The CFNAI also tells the same story with large divergences in consumer confidence eventually “catching down” to the underlying index.
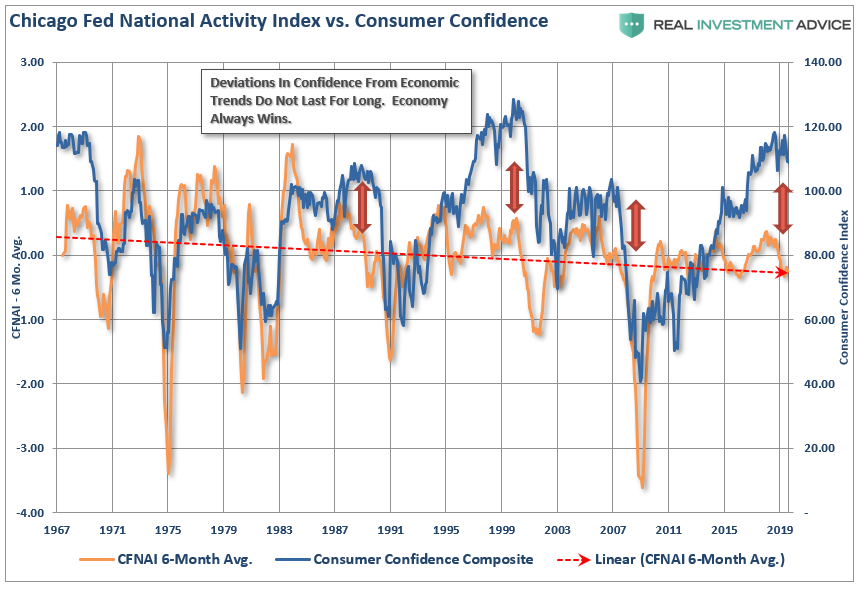
This chart suggests that we will begin seeing weaker employment numbers and rising layoffs in the months ahead, if history is any guide to the future.
This last statement is key to our ongoing premise of weaker than anticipated economic growth despite the Federal Reserve’s ongoing liquidity operations. The current trend of the various economic data points on a broad scale are not showing indications of stronger economic growth but rather a continuation of a sub-par “muddle through” scenario of the last decade.
While this is not the end of the world, economically speaking, such weak levels of economic growth do not support stronger employment, higher wages, or justify the markets rapidly rising valuations. The weaker level of economic growth will continue to weigh on corporate earnings, which like the economic data, appears to have reached their peak for this current cycle.
The CFNAI, if it is indeed predicting weaker economic growth over the next couple of quarters, also doesn’t support the recent rotation out of defensive positions into cyclical stocks that are more closely tied to the economic cycle. The current rotation is based on the premise that economic recovery is here, however, the data hasn’t confirmed it as of yet.
Either the economic data is about to take a sharp turn higher, or the market is set up for a rather large disappointment when the expected earnings growth in the coming quarters doesn’t appear. From all of the research we have done lately, the latter point seems most likely as a driver for the former seems lacking.
Maybe the real question is why we aren’t paying closer attention to what this indicator has to tell us?