
Wolf Richter wolfstreet.com, http://www.amazon.com/author/wolfrichter
Vancouver housing bubble sags. Toronto down 3.4% from peak. Calgary and Edmonton back to 2007. Montreal sets new record. National index ticks up the least for any May in 21 years of data.
Home prices across major metros in Canada ticked up 0.5% in May from the prior month, the slowest rise for any May in the 21-year history of the Teranet-National Bank House Price Index. “If seasonally adjusted, the index would have been down 0.4% on the month,” the report said. But real estate is local, with wide variations from market to market, and so here we go.
Vancouver:
In Greater Vancouver, house prices, instead of rising seasonally, declined 0.2% in May from April, the 10th month in a row of declines, according to the Teranet-National Bank House Price Index. The index is down 5.0% from the peak in July 2018, the sharpest 10-month decline since July 2009. And it’s down 4.1% compared to May 2018:
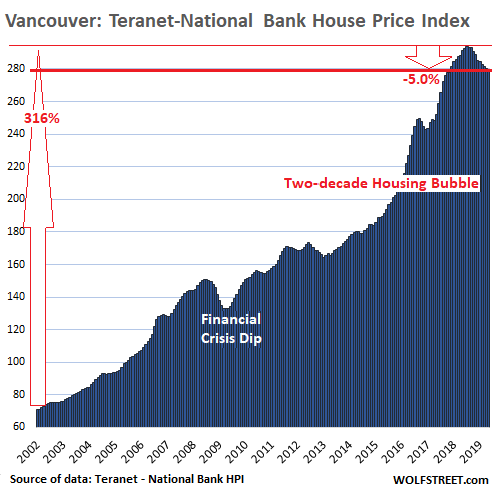
Vancouver was one of the most splendid housing bubbles the world has ever seen as prices more than quadrupled in 16 years, skyrocketing 316% from January 2002 to the peak in July 2018. But this splendid bubble has developed some serious leaks.
The Teranet-National Bank House Price Index tracks single-family house prices, based on “sales pairs.” It compares the sales price of a house in the current month to the price when the same house sold previously, often many years earlier. The methodology of “sales pairs” eliminates some of the issues associated with median-price indices, which for Vancouver are pointing at much steeper price declines.
In the US, the S&P CoreLogic Case Shiller index also uses the “sales pairs” method, so we can compare the data for the Vancouver housing bubble to the San Francisco Bay Area housing bubble to see which is the most splendid, in one chart, with Vancouver as black columns and the San Francisco Bay Area as red columns, and with both indices converted into “percent change from January 2002.” Note how Vancouver’s housing market only dipped during the big-bad Financial Crisis while San Francisco’s slumped deeply for four years:

Toronto:
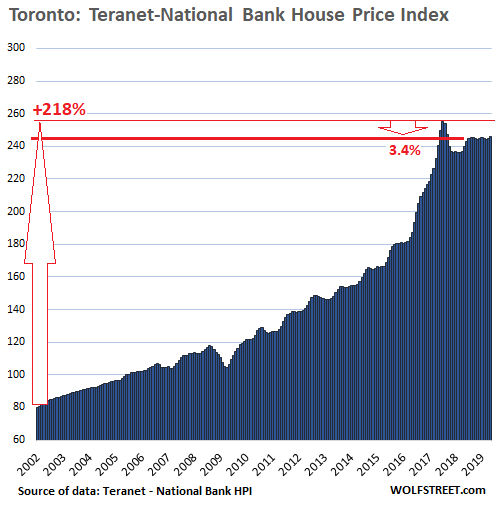
House prices in the Greater Toronto Area (GTA) rose 0.7% in May from April, according to the HPI, and are up 2.6% from May last year, but remain down 3.4% from the peak in July 2017. Despite minor ups and downs, the index has been essentially flat since July 2018.
Over the 15 years from January 2002 through the peak in July 2017, house prices more than tripled, with the index soaring 218%. But Toronto cannot hold a candle to Vancouver, where prices had quadrupled over the same period. For perspective, all charts here are on the same scale. Hence, Toronto’s chart shows more white space:
Victoria:
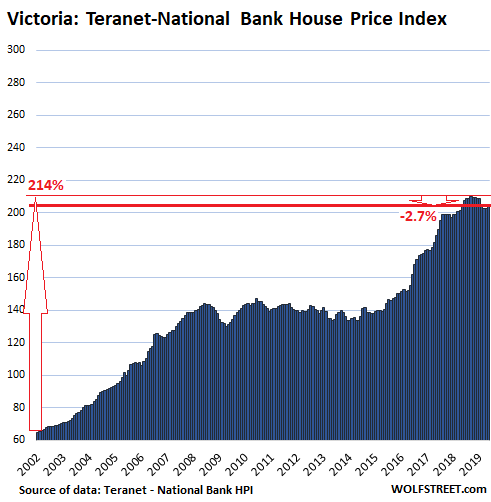
House prices in Victoria, BC, followed seasonality and rose 0.7% in May, according to the Teranet-National Bank House Price Index. The index had more than tripled between January 2002 and the peak in September 2018. But prices are down 0.4% from May last year and 2.7% from the peak. The chart is on the same scale as Vancouver’s, hence the additional white space:
Winnipeg:
House prices in the Winnipeg metro area ticked up 0.5% in May from April, after a hard 2.0% drop in the prior month, according to the HPI. The index is down 3.7% from the peak in September 2018. This took the index back to where it had first been in August 2016.
In the Winnipeg metro – which is surrounded by lots of land and I mean on an epic scale – house prices had nearly tripled in the 12 years between January 2002 and the peak in September 2014, with just a hiccup during the Financial Crisis. Since September 2014, house prices have stalled however, and with the decline over the past six months, they’re now up only 2.5% from where they’d first been nearly five years ago:

Montreal:
For the metropolitan area of Montreal, the House Price Index rose 0.5% in May from April to a new peak. The index has risen 160% over the past 16 years, not even dipping during the Financial Crisis. While this surge would have been huge by just about any standard, it’s only about half of the Vancouver mindblower over the same period. Hence, the white space is beginning to dominate the chart:

Quebec City:
House prices in the Quebec City metro rose 0.8% in May from April, continuing their mild ups and downs that have kept the index essentially flat since July 2014, after a white-hot 160% gain in the 12 years from January 2002 through July 2014:

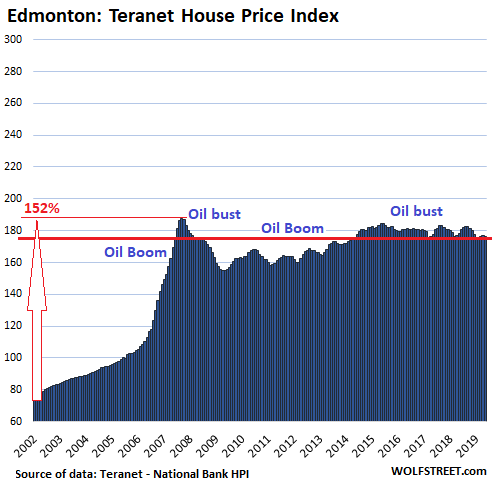
Edmonton:
Canada has two major oil towns, Calgary and Edmonton, whose economies are dominated by oil booms and busts, and housing too follows oil. The prior oil boom caused house prices to skyrocket 87% from June 2005 through October 2007. Just nuts! This bubble promptly collapsed, and house prices are still not back where they’d been 12 years ago, and declined again in May, despite what should have been a seasonal increase. The HPI is down about 6% from its peak in October 2007 but thanks to the glorious bubble in 2005-2007, it remains up 136% from January 2002:
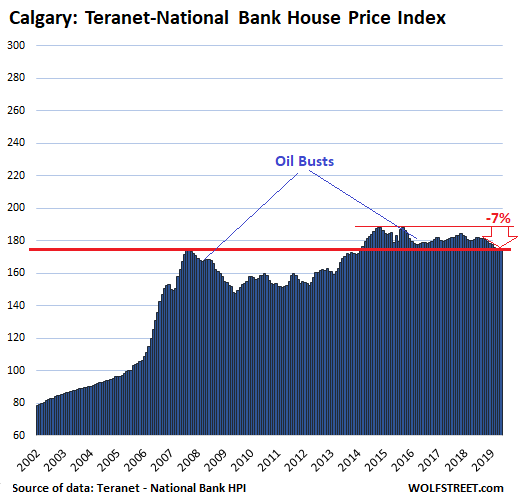
Calgary:
Oil booms and busts, always. House prices in the Calgary metro ticked up 0.3% in May from April, but remain down 7% from their peak in October 2014, and are back where they’d first been 12 years ago in July 2007. The HPI has gained 123% since January 2002, compared to Vancouver’s 316% gain:
House price movements that are measured by comparing the price of the same house as it changes hands over time – “sales pairs” method, such as the Teranet-National Bank House Price Index in Canada or the S&P CoreLogic Case Shiller index in the US – in fact measure how many dollars it takes to buy the same house over time. When the price of the house doubles, it’s not an indication that the house got twice as big or twice as opulent, but that the dollar has lost its purchasing power with regards to the same house, and it now takes twice as many dollars to buy the same house. And so these indices are good measures of house price inflation, similar to indices that measure consumer price inflation.