Wolf Richter wolfstreet.com, http://www.amazon.com/author/wolfrichter
Asking rents spiral down in Chicago & Honolulu, come unglued in Washington DC, drift lower in New York City, but see double-digit surges in Southern California and many less expensive markets.
Let’s start with Chicago and then swing to Southern California to get a flair for the drama on the ground that gets averaged out in the national figures.
Chicago rents peaked in the fall of 2015 and have since spiraled lower. In July, the median 1-BR asking rent dropped 5% from a year ago, to $1,510, and is down 26% from the peak in October 2015. For a 2-BR, median asking rent plunged 13.6% year-over-year and is down 30% from the peak.
Like other cities, Chicago has an apartment construction boom. In the Chicago-Naperville-Elgin metro area, 10,700 apartments are expected to be delivered in 2018, for a population of 9.5 million. And this is a problem – because Chicago’s population has dropped by 27,000 people since its peak in 2014. In late 2015, asking rents peaked. As new apartments came on the market and as more people left, demand withered and rent began to spiral down.
But rents in Southern California are soaring. In Los Angeles, the median 1-BR asking rent, after setting a record in June, ticked down in July to $2,330. The median 2-BR asking rent also set a record in June and ticked down in July to $3,210 – the second most expensive 2-BR asking rent in the country, after San Francisco. Rents for 1-BR and 2-BR apartments in San Diego soared 15.6% and 8.4% in July compared to a year ago. In Santa Ana, Anaheim, and Long Beach, a similar scenario is playing out.
But on a nationwide basis, these dramatic differences between individual metros get averaged-out: Median asking rent for 1-BR apartments across the US rose 2.7% in July compared to a year ago, to $1,208. And for a 2-BR, it rose 2.7% to $1,446.
These are median asking rents – “median” means half are higher and half are lower – in multifamily apartment buildings, including new construction, as they appeared in active listings as apartments for rent in cities across the US. The data, collected and released by Zumper, reflects the current market as landlords are trying to price it. The data in Zumper’s National Rent Reportdoes not track the actual rents agreed to between landlord and tenant and does not include “concessions,” such as “1 month free” or “2 months free.” Single-family houses for rent are also not included.
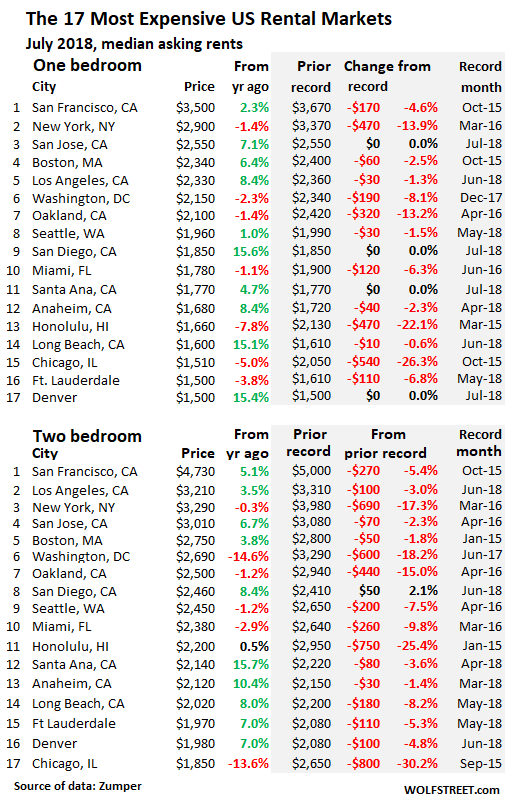
The table below shows the 17 of the 100 most expensive major rental markets in the US. The shaded area shows peak rents and the movements since then. The black “0%” in the shaded area means that these markets set new records in July. If rents are down by a few bucks from the peak a few months ago, it doesn’t yet mean that the market has turned – a turning point would require more prolonged data. For the first time, the list includes Denver:
Some standouts:
Washington DC rents have suddenly come under pressure: 1-BR rents in July are down 8.1% from their peak just last December. And 2-BR rents have plunged 18.2% from the peak in June 2017. That was fast.
Honolulu rents are struggling to find a bottom. The 1-BR rent fell 7.8% year-over-year and is down 22% from the peak in March 2015. But the 2-BR rent it ticked up 0.5% from a year ago to $2,200 though it remains 25% below the peak in January 2015.
New York City had long been the second-most expensive rental market in the country, after San Francisco. But in May, the median 2-BR asking rent fell into third place, behind Los Angeles, due to dropping rents in New York and soaring rents in Los Angeles. Note the double-digit declines from the peak.
In San Francisco, the most expensive major rental market in the US, rents peaked in October 2015, then began to descend sharply before starting to tick up again, but remain below their 2015 peak.
With the asking rent for a 1-BR at $3,500 and for a 2-BR at $4,730, and with 1,503 apartments listed for rent at the moment on Zillow (up 31% from the 1,149 in August 2016), one thing is clear: There’s no shortage of supply but a shortage of supply in a range that households can afford. Hence the local term, “Housing Crisis.” It’s a crisis of affordability, not availability.
In the Seattle metro, 8,600 new apartments are scheduled to be delivered this year, after the surge in 2016 and 2017; and 25,000 apartments are under construction. So a lot of supply is coming on the market. But it’s high-end supply, and affordability has become a crisis too. Despite this onslaught of supply, Seattle’s median 1-BR asking rent hit a record in June, and just inched down from it in July. But 2-BR rents remain 7.5% below the peak in April 2016.
This scenario of some markets experiencing double-digit year-over-year increases, while others are experiencing double-digit declines is playing out across the US. In fact, rent increases of around 15% are common in many of the less expensive markets – from about #60 on down in the list below. For renters living in those markets, the end of a lease can trigger real anguish and worse. For them, the averaged-out national numbers with the soothingly small increases are meaningless.
The table below shows Zumper’s list of the 100 most expensive major rental markets in the US, in order of median asking rent for 1-BR apartments in July, and percentage changes from a year ago (use the browser search box to find a city):
| Pos. | City | 1 BR Rent | Y/Y % | 2 BR Rent | Y/Y % |
| 1 | San Francisco, CA | $3,500 | 2.3% | $4,730 | 5.1% |
| 2 | New York, NY | $2,900 | -1.4% | $3,290 | -0.3% |
| 3 | San Jose, CA | $2,550 | 7.1% | $3,010 | 6.7% |
| 4 | Boston, MA | $2,340 | 6.4% | $2,750 | 3.8% |
| 5 | Los Angeles, CA | $2,330 | 8.4% | $3,210 | 3.5% |
| 6 | Washington, DC | $2,150 | -2.3% | $2,690 | -14.6% |
| 7 | Oakland, CA | $2,100 | -1.4% | $2,500 | -1.2% |
| 8 | Seattle, WA | $1,960 | 1.0% | $2,450 | -1.2% |
| 9 | San Diego, CA | $1,850 | 15.6% | $2,460 | 8.4% |
| 10 | Miami, FL | $1,780 | -1.1% | $2,380 | -2.9% |
| 11 | Santa Ana, CA | $1,770 | 4.7% | $2,140 | 15.7% |
| 12 | Anaheim, CA | $1,680 | 8.4% | $2,120 | 10.4% |
| 13 | Honolulu, HI | $1,660 | -7.8% | $2,200 | 0.5% |
| 14 | Long Beach, CA | $1,600 | 15.1% | $2,020 | 8.0% |
| 15 | Chicago, IL | $1,510 | -5.0% | $1,850 | -13.6% |
| 16 | Denver, CO | $1,500 | 15.4% | $1,980 | 7.0% |
| 16 | Fort Lauderdale, FL | $1,500 | -3.8% | $1,970 | 3.7% |
| 16 | Philadelphia, PA | $1,500 | 7.1% | $1,700 | 6.3% |
| 19 | Portland, OR | $1,470 | 8.9% | $1,730 | 8.8% |
| 20 | Atlanta, GA | $1,460 | 11.5% | $1,870 | 12.7% |
| 21 | Minneapolis, MN | $1,390 | 15.8% | $1,860 | 10.1% |
| 22 | Baltimore, MD | $1,380 | 3.0% | $1,670 | 15.2% |
| 23 | Nashville, TN | $1,370 | 15.1% | $1,450 | 2.8% |
| 23 | Providence, RI | $1,370 | 0.7% | $1,520 | 6.3% |
| 25 | New Orleans, LA | $1,340 | 6.3% | $1,530 | -4.4% |
| 26 | Dallas, TX | $1,300 | 0.0% | $1,780 | -1.1% |
| 27 | Houston, TX | $1,280 | 14.3% | $1,600 | 15.9% |
| 27 | Madison, WI | $1,280 | 8.5% | $1,420 | 15.4% |
| 29 | Scottsdale, AZ | $1,260 | 9.6% | $1,950 | -2.5% |
| 30 | Orlando, FL | $1,250 | 15.7% | $1,440 | 15.2% |
| 31 | Sacramento, CA | $1,200 | 7.1% | $1,410 | 13.7% |
| 32 | Austin, TX | $1,190 | 10.2% | $1,480 | 7.2% |
| 33 | Charlotte, NC | $1,180 | 3.5% | $1,290 | 4.9% |
| 33 | Plano, TX | $1,180 | 4.4% | $1,570 | 5.4% |
| 35 | Tampa, FL | $1,160 | 8.4% | $1,380 | 9.5% |
| 36 | Aurora, CO | $1,140 | 14.0% | $1,460 | 5.0% |
| 36 | Irving, TX | $1,140 | -0.9% | $1,540 | 8.5% |
| 38 | Durham, NC | $1,130 | 15.3% | $1,310 | 15.9% |
| 39 | Newark, NJ | $1,120 | 14.3% | $1,390 | 15.8% |
| 40 | Fort Worth, TX | $1,100 | 15.8% | $1,310 | 14.9% |
| 41 | Pittsburgh, PA | $1,090 | -9.2% | $1,340 | -2.2% |
| 42 | Buffalo, NY | $1,080 | 14.9% | $1,400 | 7.7% |
| 42 | Gilbert, AZ | $1,080 | 3.8% | $1,340 | 0.0% |
| 44 | Henderson, NV | $1,060 | 11.6% | $1,240 | 13.8% |
| 45 | Chandler, AZ | $1,050 | 8.2% | $1,280 | 8.5% |
| 45 | Chesapeake, VA | $1,050 | 14.1% | $1,200 | 0.8% |
| 45 | Richmond, VA | $1,050 | 5.0% | $1,250 | 4.2% |
| 48 | Salt Lake City, UT | $1,040 | 15.6% | $1,350 | 14.4% |
| 48 | St Petersburg, FL | $1,040 | 15.6% | $1,500 | 7.9% |
| 50 | Virginia Beach, VA | $1,030 | 1.0% | $1,200 | 0.0% |
| 51 | Raleigh, NC | $1,000 | -2.9% | $1,190 | 2.6% |
| 52 | Phoenix, AZ | $970 | 11.5% | $1,190 | 8.2% |
| 53 | Jacksonville, FL | $950 | 8.0% | $1,090 | 1.9% |
| 53 | Kansas City, MO | $950 | 13.1% | $1,100 | 10.0% |
| 55 | Boise, ID | $940 | 14.6% | $980 | 8.9% |
| 56 | Las Vegas, NV | $930 | 14.8% | $1,150 | 15.0% |
| 57 | Milwaukee, WI | $910 | 15.2% | $1,110 | 15.6% |
| 57 | San Antonio, TX | $910 | 9.6% | $1,160 | 11.5% |
| 59 | Anchorage, AK | $900 | 4.7% | $1,100 | -8.3% |
| 59 | Mesa, AZ | $900 | 11.1% | $1,030 | 8.4% |
| 61 | Colorado Springs, CO | $890 | 12.7% | $1,120 | 1.8% |
| 61 | Corpus Christi, TX | $890 | 2.3% | $1,070 | 7.0% |
| 61 | Fresno, CA | $890 | 7.2% | $1,130 | 13.0% |
| 64 | Syracuse, NY | $870 | 4.8% | $1,120 | 12.0% |
| 65 | Des Moines, IA | $860 | 3.6% | $930 | 2.2% |
| 65 | Louisville, KY | $860 | 6.2% | $980 | 15.3% |
| 67 | Omaha, NE | $850 | 9.0% | $1,100 | 15.8% |
| 68 | Reno, NV | $840 | 15.1% | $1,220 | 15.1% |
| 68 | Rochester, NY | $840 | 15.1% | $1,020 | 15.9% |
| 70 | Baton Rouge, LA | $830 | 3.8% | $910 | 0.0% |
| 70 | Knoxville, TN | $830 | 10.7% | $920 | 15.0% |
| 70 | Laredo, TX | $830 | 15.3% | $990 | 11.2% |
| 73 | Norfolk, VA | $820 | 13.9% | $1,000 | 11.1% |
| 74 | Arlington, TX | $810 | 15.7% | $1,080 | 14.9% |
| 74 | Cincinnati, OH | $810 | 15.7% | $1,110 | 14.4% |
| 76 | Cleveland, OH | $800 | 15.9% | $900 | 15.4% |
| 76 | St Louis, MO | $800 | 14.3% | $1,170 | 14.7% |
| 78 | Lexington, KY | $790 | -3.7% | $940 | 1.1% |
| 79 | Bakersfield, CA | $780 | 11.4% | $890 | -1.1% |
| 79 | Columbus, OH | $780 | 14.7% | $1,060 | 15.2% |
| 81 | Chattanooga, TN | $770 | 13.2% | $810 | 5.2% |
| 81 | Glendale, AZ | $770 | 13.2% | $1,030 | 14.4% |
| 83 | Spokane, WA | $760 | 11.8% | $940 | 14.6% |
| 83 | Winston Salem, NC | $760 | 15.2% | $840 | 15.1% |
| 85 | Memphis, TN | $740 | 13.8% | $780 | 14.7% |
| 86 | Greensboro, NC | $730 | 15.9% | $840 | 2.4% |
| 86 | Lincoln, NE | $730 | 9.0% | $960 | 15.7% |
| 86 | Tallahassee, FL | $730 | 15.9% | $850 | 10.4% |
| 89 | Augusta, GA | $720 | 14.3% | $830 | 6.4% |
| 90 | Oklahoma City, OK | $710 | 12.7% | $840 | 7.7% |
| 91 | Indianapolis, IN | $680 | 13.3% | $810 | 15.7% |
| 92 | Albuquerque, NM | $650 | 3.2% | $840 | 5.0% |
| 93 | Shreveport, LA | $640 | 14.3% | $740 | 13.8% |
| 94 | El Paso, TX | $630 | -3.1% | $760 | 1.3% |
| 94 | Tucson, AZ | $630 | -3.1% | $850 | 0.0% |
| 96 | Tulsa, OK | $610 | 1.7% | $770 | 2.7% |
| 96 | Wichita, KS | $610 | 15.1% | $750 | 15.4% |
| 98 | Detroit, MI | $600 | 13.2% | $690 | 15.0% |
| 98 | Lubbock, TX | $600 | 5.3% | $780 | 4.0% |
| 100 | Akron, OH | $570 | 7.5% | $750 | 15.4% |