Wolf Richter wolfstreet.com, http://www.amazon.com/author/wolfrichter
How does it compare to German, Japanese, and Chinese yield curves?
On Friday, the US Treasury 2-year yield rose to 2.63% and the 10-year yield remained at 2.82%. This squeezed the spread between them to just 19 basis points, the lowest since August 2007.
This is a further step in the “flattening yield curve,” where short-term yields and long-term yields move closer together. Unless the 10-year yield gets on the rate-hike bandwagon and jumps, it might soon be lower than the 2-year yield – a condition called yield-curve “inversion.” This happens as shorter-term yields rise following the Fed’s rate hikes but long-term yields refuse to budge. The way it looks, it is hell-bent on doing just that:
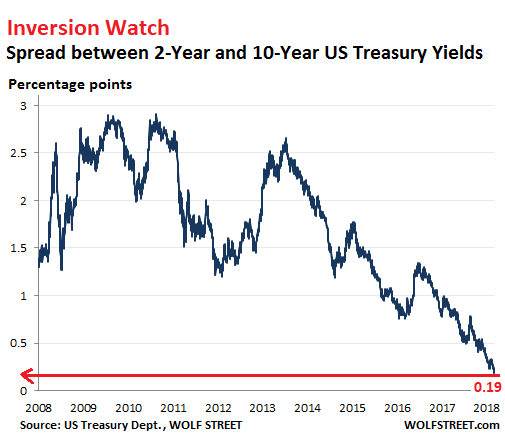
If the line in the chart above drops below zero, with the 10-year yield higher than the 2-year yield, the yield curve has “inverted.” In the past, this condition was followed by recessions.
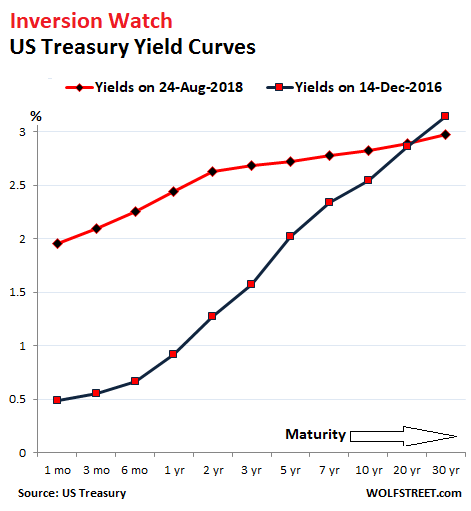
The chart below shows the yield curves on December 14, 2016, when the Fed got serious about raising rates (blue line) and on Friday August 24 (red line). Note how the red line has “flattened” compared to the black line, especially from the 2-year yield on out. The 19-basis-point spread between the 2-year and the 10-year markers is tiny compared to the 127-basis-point spread on December 14, 2016:
How does this situation compare to the government bond markets in Japan, Germany, and China?
When it comes to government bond markets, the term “market” as a place where price discovery takes place is essentially a misnomer these days because there is no market in the sense that real price discovery is taking place, in the era of zero-interest-rate policies, negative-interest-rate policies, and massive QE (Eurozone), stealth QE (China), and QQE (Japan).
Here are the yield curves of the US, Japan, Germany, and China, with current yield in brighter colors and the yields of July 20 in washed-out colors:
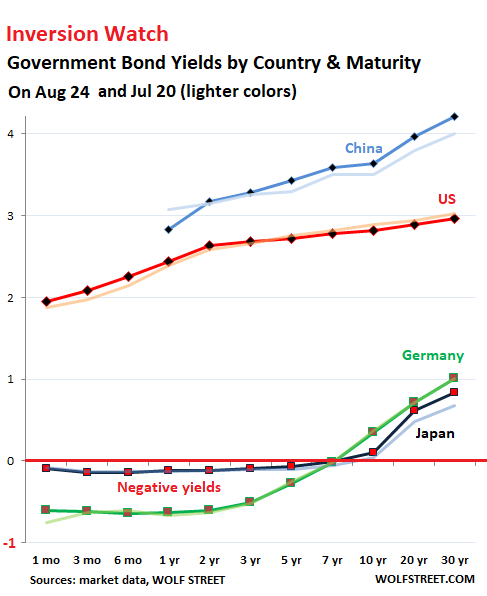
Japan (dark blue line with red markers):
With the 2-year yield at negative -0.11% and the 10-year yield at positive 0.10%, the spread between them is 21 basis points – wider than the US Treasury spread! Japanese yields of 7 years and below are negative, but only slightly, and their end of the yield curve is flat. Note how the yield curve steepened from the 10-year yield up as the 20-year and 30-year yields rose from July 20 (light blue line).
The amount of Japanese government debt has ballooned, but the market has withered as a majority of these securities are held by the Bank of Japan and government-controlled entities, such as the Post Bank and the Government Pension and Investment Fund. There are days when not a single 10-year JGB is traded. So forget price discovery. The BOJ runs the entire show.
The BOJ’s short-term interest-rate target is a negative -0.1%. In September 2016, it also introduced “Yield Curve Control” as part of its QQE bond-buying program. This policy directly manipulates the entire yield curve. The stated purpose is to keep the 10-year yield near but above 0%. So what you see in the chart above is what the BOJ wants.
Germany (green line with red markers):
The ECB’s “deposit facility” rate currently is negative -0.4%. Its large-scale QE program pushed the entire yield curve down, and short-term yields deeply into the negative even for countries in shaky fiscal condition. German yields are negative through 7-year maturities, with the 8-year yield just barely in the positive (0.11%).
The German yield curve is flat through 3-year yields then steepens as yields become less negative and finally slightly positive. With the 2-year yield at negative -0.61% and the 10-year yield at positive 0.35%, the spread between them is 96 basis points — over four times the spread between equivalent US yields!
China (light blue line, blue markers):
The spread between China’s 2-year yield (3.17%) and the 10-year yield (3.64%) is 47 basis points, up from 36 basis points on July 20. So its yield curve too has steepened. Chinese government bonds play a relatively small role in the gigantic debt bubble in China, consisting of bonds of other government entities, their off-balance-sheet vehicles, state-owned enterprises, and China’s corporate sector in general, all of them now a massive, opaque, convoluted tangle. This “hidden debt,” as it’s called, is the newest puzzle the Chinese government is trying to figure out how to even quantify, as it is struggling to keep it all from imploding.
In the US, where the Fed has been raising rates “gradually” since December 2015, a flattening yield curve is part of the deal. An inversion however, would be unwelcome. But given the Fed-manipulations of the Treasury market over the past decade, an inversion might no longer indicate what prior inversions had indicated – and there have been discussions at the Fed to that effect.
But neither the ECB nor the Bank of Japan have raised their policy rates yet, and so their respective yield curves remain untouched from those effects. However, both have backed off from QE. The ECB will stop QE entirely by year-end, and rate hikes are on its menu for next year, which will doubtlessly trigger more yield-curve fireworks down the road.