Wolf Richter wolfstreet.com, www.amazon.com/author/wolfrichter
Here’s my math when this “balance sheet normalization” will end.
In August, the Federal Reserve was supposed to shed up to $24 billion in Treasury securities and up to $16 billion in Mortgage Backed Securities (MBS), for a total of $40 billion, according to its QE-unwind plan – or “balance sheet normalization.” The QE unwind, which started in October 2017, is still in ramp-up mode, where the amounts increase each quarter (somewhat symmetrical to the QE declines during the “Taper”). The acceleration to the current pace occurred in July. So how did it go in August?
Treasury Securities
The Fed released its weekly balance sheet Thursday afternoon. Over the period from August 2 through September 5, the balance of Treasury securities declined by $23.7 billion to $2,313 billion, the lowest since March 26, 2014. Since the beginning of the QE-Unwind, the Fed has shed $152 billion in Treasuries:
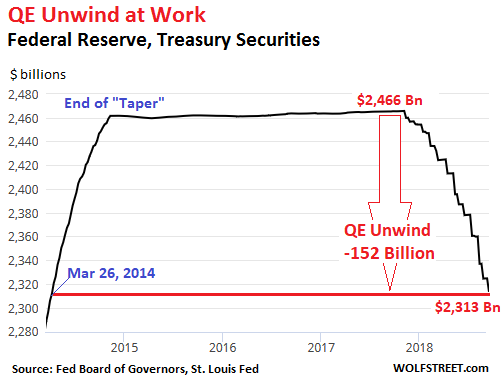
The step-pattern of the QE unwind in the chart above is a consequence of how the Fed sheds Treasury securities: It doesn’t sell them outright but allows them to “roll off” when they mature; and they only mature mid-month or at the end of the month.
On August 15, $23 billion in Treasuries matured. On August 31, $21 billion matured. In total, $44 billion matured during the month. The Fed replaced about $20 billion of them with new Treasury securities directly via its arrangement with the Treasury Department that cuts out Wall Street – the “primary dealers” with which the Fed normally does business. Those $20 billion in securities were “rolled over.”
But it did not replace about $24 billion of maturing Treasuries. They “rolled off” and became part of the QE unwind.
Mortgage-Backed Securities (MBS)
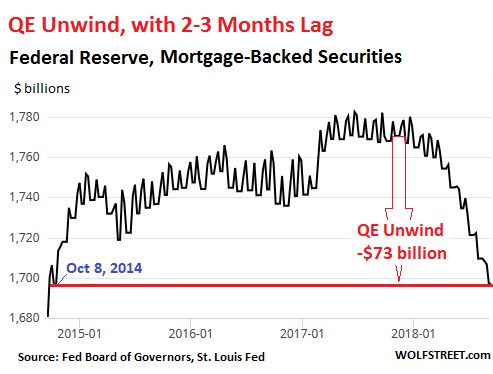
The Fed is also shedding is pile of MBS. Under QE, the Fed bought residential MBS that were issued and guaranteed by Fannie Mae, Freddie Mac, and Ginnie Mae. Holders of residential MBS receive principal payments as the underlying mortgages are paid down or are paid off. At maturity, the remaining principal is paid off. To keep the balance of MBS from declining after QE had ended, the New York Fed’s Open Market Operations (OMO) kept buying MBS.
The Fed books the trades at settlement, which occurs two to three months after the trade. Due to this lag of two to three months, the Fed’s balance of MBS reflects trades from the second quarter. In August, the cap for shedding MBS was $16 billion. But at the time of the trades reflected on the August balance sheet, the cap was $12 billion.
Over the period from August 2 through September 5, the balance of MBS fell by $11.5 billion, to $1,697 billion, the lowest since October 8, 2014. In total, $73 billion in MBS have been shed since the beginning of the QE unwind:
The QE unwind is scheduled to reach cruising speed in October, when the unwind is capped at $50 billion a month. The plan calls for shedding up to $420 billion in securities in 2018 and up to $600 billion a year in each of the following years until the Fed deems its balance sheet adequately “normalized” – or until something big breaks. Based on current discussions, as part of this “normalization,” the Fed is likely to get rid of all its MBS and retain only Treasury securities.
Total Assets on the Balance Sheet
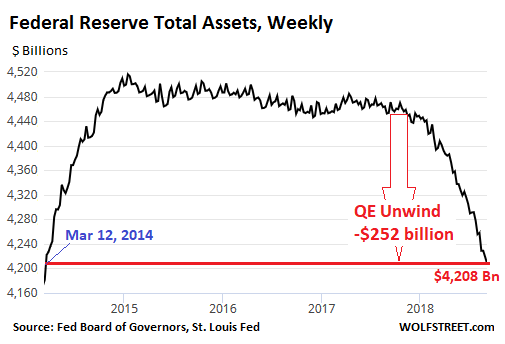
The balance sheet also reflects the Fed’s other activities. Total assets for the period from August 2 through September 5 dropped by $47 billion. This brought the decline since October 2017, when the QE unwind began, to $252 billion. At $4,208 billion, total assets are now at the lowest level since March 12, 2014:
When will this Balance Sheet Normalization end?
It took the Fed about six years to pile on these securities. It’s going to take a number of years to shed them. But the balance sheet will never go back to where it had been before QE for the simple reason that as the economy grows, the Fed’s balance sheet expands along with it.
The chart below shows this relationship as it existed before the Financial Crisis. It depicts the total assets on the Fed’s balance sheet (blue line) and nominal GDP seasonally adjusted annual rate (red line). All data is quarterly:
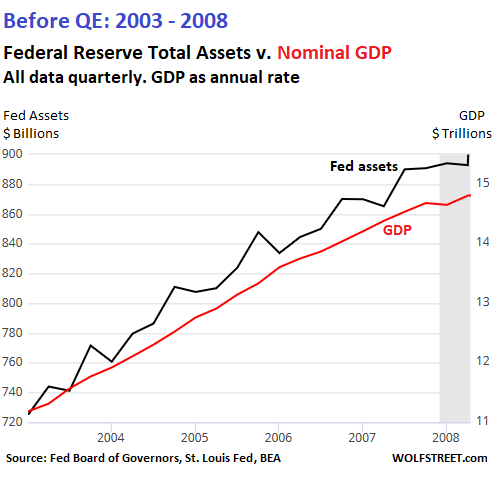
There is no telling what the Fed will do in terms of its balance sheet. But by looking at the past and extrapolating into the future, we can a least get a feel for the lower range — the level below which the Fed will certainly not go.
GDP: Since 2008, nominal GDP has grown 38% from $14.8 trillion to $20.4 trillion.
Balance sheet: In 2008, just before the Fed’s gyrations started, total assets amounted to $892 billion. If the Fed’s balance sheet had grown since then at the same rate as nominal GDP, it would be $1.23 trillion today. That’s sort of a base line.
The Future:
If nominal GDP (not adjusted for inflation) grows at 5% per year (slightly below the current rate), it will reach $24.8 trillion in Q2 2022.
If the Fed’s balance sheet had not experienced QE, and if it had grown since 2008 at the same rate as nominal GDP, it would reach about $1.5 trillion in Q2 2022.
So, if the QE unwind proceeds at $550 billion a year (below the cap of $600 billion), the Fed’s total assets will drop to about $2 trillion by Q2 2022.
This range between $1.5 trillion and $2 trillion will mark the absolute low end of the Fed’s balance sheet by the time normalization ends in 2022. And most of those assets will be Treasury securities. What little MBS will be left on its balance sheet by then will be shed in future years. This is my math, and I’m sticking to it.
An entire generation on Wall Street has never seen Treasury yields this high. Read… These “Gradual” Rate Hikes Start to Add Up: US Treasury Yields up to Three Years Hit 10-Year Highs