By John Mauldin
Last week, the yield curve inverted for the first time since 2007. The yield for 10-year Treasuries fell below the yield for the 3-month T-Bill.
The inversion set off alarm bells and US stocks fell sharply. While concerns are reasoned, the alarm bells may be premature.
Inversion is an historically reliable but early recession indicator. The yield curve isn’t saying recession is imminent, although it’s likely.
An Inverted Yield Curve Is Just a Fever
Many analysts seem to think that an inverted yield curve causes recession. That is simply not true.
Think of an inverted yield curve as a fever. When your body gets a fever, the fever is not the cause of the sickness. It just says something’s wrong with your body.
You have the flu, appendicitis, or some other ailment.
The fever indicates you are sick. But it doesn’t necessarily suggest what the sickness is. And typically, the higher the fever the more serious the condition.
It is the same with the yield curve. The more inverted the yield curve is, and the longer it stays that way, the more chance that something is economically wrong—which may show up as a recession sometime in the future.
Early Predictor
As I mentioned, the last true inversion happened in 2005.
Were we in recession then? No, not at all. The economy was booming.
In fact, the yield curve stayed inverted until mid-2007. Some of us saw cracks forming in the economy and said so at the time. But the actual recession would not begin until December 2007.
That’s a longstanding pattern.
The inverted yield curve has been a pretty reliable recession indicator, but it shows up far in advance—months or even more than a year.
We might better think of it as signaling the cycle’s “blowout” stage. People see the inversion, observe nothing bad happening, then throw caution to the wind.
In fact, stocks moved up four out of the last five times after the initial inversion for at least six months by an average of 17%.
How Far Away Is Recession?
In 1996, New York Fed economists Arturo Estrella and Frederic S. Mishkin authored a paper comparing the yield curve to 19 other indicators.
Estrella and Mishkin found the yield curve is most predictive of recession a year or so ahead of time. In fact, they concluded an inverted yield curve was the only useful predictor of recessions.
Examining all the data from 1960–1995, they calculated the probability a recession would occur four quarters ahead, based on the spread between three-month and 10-year Treasury securities.
They summarized it in this table.
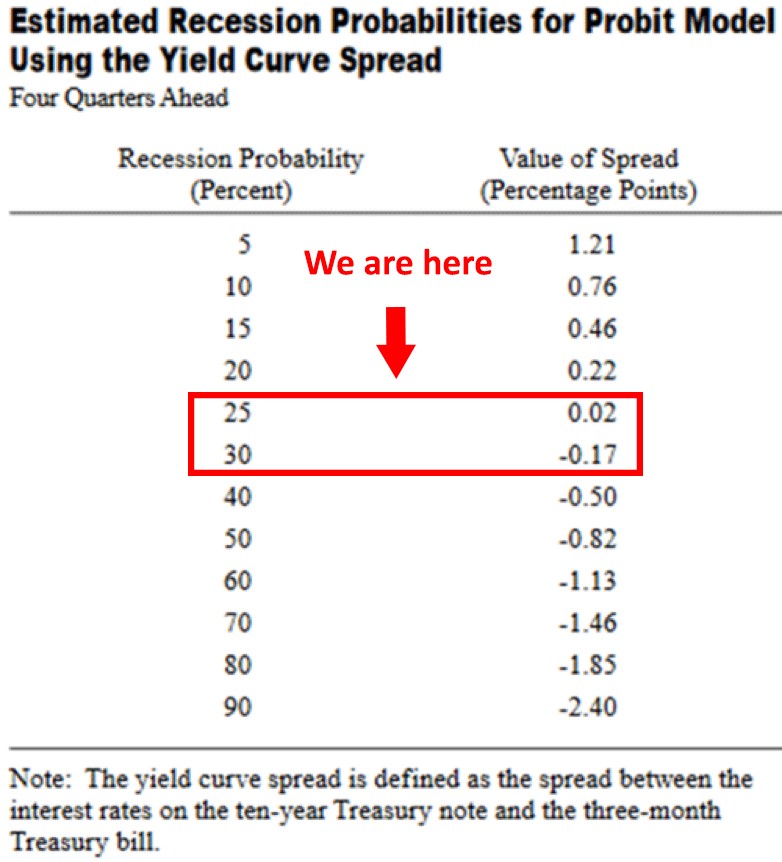
Estrella and Mishkin found recession probability begins rising as the spread drops toward and then below zero.
But notice how long it takes. Even when the curve mildly inverts with the spread at -0.17%, the odds of a recession in the next year are still only 30%.
But from a practical standpoint, by the time their model shows a 30% or 40% probability of recession, there has always been a recession.
Your next question, of course, is where are we now?
The 3M/10Y spread is about -0.02%:
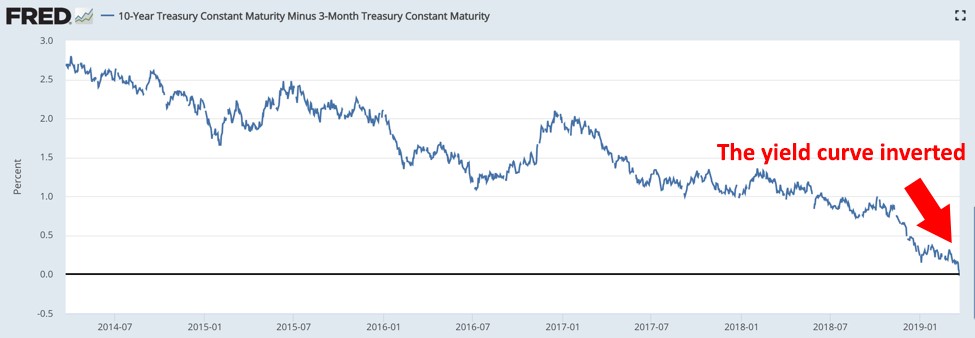
Source: FRED
The table suggests this means a 25% recession probability four quarters from now.
Not so bad if you are a bull. It means odds are good we’ll get through 2019 without recession.
Maybe longer, as the Fed paused tightening and locked in long-term yields where they are.