Skip to content

Investment Watch Blog

  • Home
  • About
  • Newsletters/RSS
  • Disclaimer

chart

The Most Important Chart In The Universe

October 17, 2018 8:38 amOctober 16, 2018 1:02 pm
Categories Sticky

Goldman Bear-Market Risk Indicator at Highest Since 1969: Chart

October 14, 2018 4:00 pm
Categories Sticky

Employment, Bank loans, Output gap chart, Foreign $ bonds

October 13, 2018 10:02 pm
Categories Sticky

Visualize the Entire Global Economy in One Chart

October 10, 2018 9:24 am
Categories Latest Story

Chart Storm

October 1, 2018 8:50 am
Categories Sticky post

Ten-Year Treasury Is At Crucial Chart Point

September 27, 2018 5:39 pm
Categories Sticky

Global central bank watch, chart

September 27, 2018 10:14 amSeptember 27, 2018 8:14 am
Categories Sticky

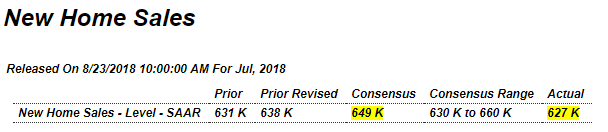
The U.S. Housing Market and Home Builders Are In Trouble — good data and chart showing 2018’s ugly housing sector. US Home Builders down most in a year since 2008.

September 26, 2018 10:19 am
Categories Sticky

Chart Chatter: $SPX

September 12, 2018 5:54 pm
Categories Latest Story

Facebook’s Volatile Year in One Giant Chart

September 11, 2018 7:21 am
Categories Sticky

MARK PERRY: The Chart of the Century

September 10, 2018 9:57 am
Categories Featured Post

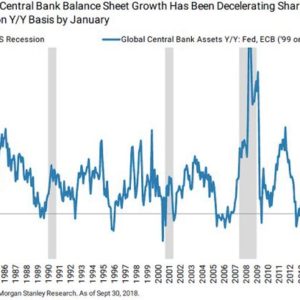
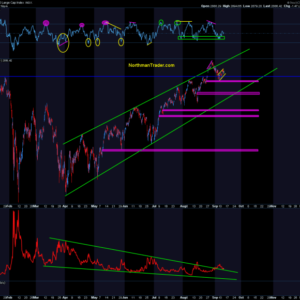
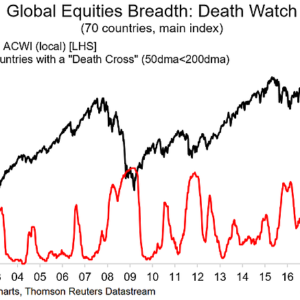
One look at this chart and you might be tempted to ‘cash out for a couple years’

September 8, 2018 10:18 am
Categories Latest Story

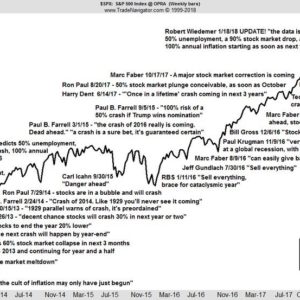
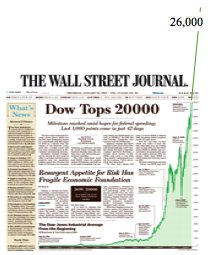
Chart of shame: The S&P 500 vs. everyone who said the market was about to crash

August 31, 2018 8:20 am
Categories Sticky post

The Chart of Shame – Why Nobody Can Time the Market

August 29, 2018 3:52 pm
Categories Sticky post

New home sales, Existing home sales, Sea containers, Wage tracker chart

August 23, 2018 4:59 pm
Categories Sticky

This Chart Shows Amazon’s Dominance in Ecommerce

August 17, 2018 4:10 pm
Categories Latest Story

The financial elite are not allowed to show You this chart

August 14, 2018 2:42 pm
Categories Featured Post

Chart Of The Day: Australia’s Record Household Debt Is A Ticking Time Bomb

August 13, 2018 9:00 pm
Categories Latest Story

Chart: Global Equities Death Cross Breadth

August 13, 2018 8:39 pm
Categories Sticky

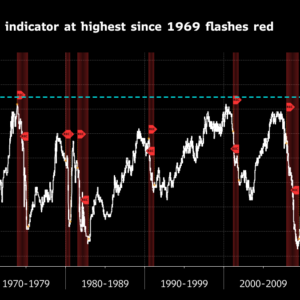
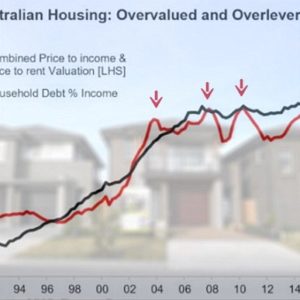
How many economists does it take to identify 3 massive bubbles shown on a chart that goes back to the 1800’s published on the cover page of the WSJ?

August 9, 2018 1:09 pm
Categories Featured Post
Older posts
Newer posts
← Previous Page1 … Page5 Page6 Page7 … Page10 Next →
  • RSS Feed
  • Twitter
  • Facebook
  • Mail

To afford free speech, IWB needs to be fully reader-funded. Please donate here

Submit Correction/News Tips/Suggestions

Privacy & Cookies: This site uses cookies. By continuing to use this website, you agree to their use. To find out more, see here: Cookie Policy Do Not Sell My Personal Information Please consider turning off your ad blocker to support our website and ensure we can continue to provide quality content for free. Disclaimer

InvestmentWatchBlog.com © 2013-2023. All Rights Reserved.

© 2025 Investment Watch Blog • Built with GeneratePress