Skip to content

Investment Watch Blog

  • Home
  • About
  • Newsletters/RSS
  • Disclaimer

chart

Today’s Chart: Those Covid Vaccines Are, Um, Different

September 20, 2021 1:22 pm
Categories Latest Story

$4.5 Trillion: The Democrats Dangerous Spending Spree In One Chart

August 30, 2021 10:32 pm
Categories Latest Story

VACCINE TRIALS TIMELINE CHART! you are HERE!

August 27, 2021 10:11 am
Categories Latest Story

The chart of the UST 10Y just keeps getting more ominous.

July 27, 2021 9:28 pm
Categories Latest Story

Latest dot on the UST10Y chart is a worry…. Uh Oh!

July 7, 2021 8:04 pm
Categories Latest Story

One Shocking Chart That Has Farmers Trembling With Fear

June 13, 2021 1:44 pm
Categories Latest Story

The Lousy Jobs Report Heralded By Biden In One Ugly Chart

June 5, 2021 10:55 am
Categories Latest Story

US Government spending. We have a couple of inches before the chart runs out. Biden is helping Wall Street making more money. It is not about the American people.

May 27, 2021 3:52 pm
Categories Featured Post

Fed chart: Distribution of large institutional leveraged loan volumes by debt to EBITDA ratio.

May 7, 2021 10:35 pm
Categories Latest Story

Think $100 Silver Is A Crazy Price…Not If You Check Out This Chart

April 29, 2021 11:09 am
Categories Latest Story

Heads up! Bitcoin to $17,000 possibly lower to $12,000! Be warned. The one month chart looks horrible!

April 25, 2021 2:13 pm
Categories Latest Story

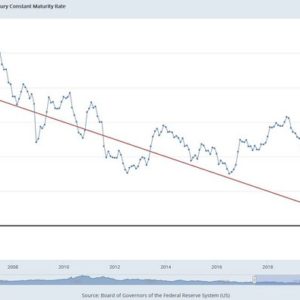
Who wants to trade the 100 year chart with me? Market crash confirmed next week or 1 year from now xd.

April 19, 2021 8:27 am
Categories Latest Story

In One Chart: Two Decades of Stock Ownership in America

April 7, 2021 10:26 am
Categories Latest Story

7-Month Rally in Gold Coming to Complete Cup-and-Handle Chart Pattern

March 31, 2021 1:37 pm
Categories Latest Story

Chart Shows How Trying to Time the Market Can Result in Big Losses

March 25, 2021 3:12 pm
Categories Latest Story

Chart Shows Glaring Economic Risk That Could Wipe out Record Highs

April 29, 2019 11:22 pm
Categories Latest Story

The reason why Uber is cashing out in one chart

April 11, 2019 5:22 pm
Categories Latest Story

PMI this chart is confirming the falling PMIs around the world..

April 1, 2019 2:12 pm
Categories Sticky post

Technically Speaking: Monthly Chart Review Yields Bearish Signals

March 5, 2019 8:30 am
Categories Latest Story

Housing index, Las Vegas visitors, Policy news chart

February 19, 2019 9:49 pm
Categories Sticky
Older posts
Newer posts
← Previous Page1 … Page3 Page4 Page5 … Page10 Next →
  • RSS Feed
  • Twitter
  • Facebook
  • Mail

To afford free speech, IWB needs to be fully reader-funded. Please donate here

Submit Correction/News Tips/Suggestions

Privacy & Cookies: This site uses cookies. By continuing to use this website, you agree to their use. To find out more, see here: Cookie Policy Do Not Sell My Personal Information Please consider turning off your ad blocker to support our website and ensure we can continue to provide quality content for free. Disclaimer

InvestmentWatchBlog.com © 2013-2023. All Rights Reserved.

© 2025 Investment Watch Blog • Built with GeneratePress